- Python pandas教程
- Python Pandas - 主页
- Python Pandas - 简介
- Python Pandas - 环境设置
- 数据结构简介
- Python pandas - 系列
- Python Pandas - 数据帧
- Python Pandas - 面板
- Python Pandas - 基本功能
- 描述性统计
- 功能应用
- Python Pandas - 重新索引
- Python Pandas - 迭代
- Python Pandas - 排序
- 处理文本数据
- 选项和定制
- 索引和选择数据
- 统计功能
- Python Pandas - 窗口函数
- Python Pandas - 聚合
- Python Pandas - 缺失数据
- Python Pandas - GroupBy
- Python Pandas - 合并/连接
- Python Pandas - 连接
- Python Pandas - 日期功能
- Python Pandas - Timedelta
- Python Pandas - 分类数据
- Python Pandas - 可视化
- Python Pandas - IO 工具
- Python Pandas - 稀疏数据
- Python Pandas - 注意事项和陷阱
- 与SQL的比较
- Python Pandas 有用资源
- Python Pandas - 快速指南
- Python Pandas - 有用的资源
- Python Pandas - 讨论
Python Pandas - 快速指南
Python Pandas - 简介
Pandas 是一个开源 Python 库,利用其强大的数据结构提供高性能的数据操作和分析工具。Pandas 这个名字来源于“面板数据”这个词——来自多维数据的计量经济学。
2008 年,当需要高性能、灵活的数据分析工具时,开发人员 Wes McKinney 开始开发 pandas。
在 Pandas 之前,Python 主要用于数据处理和准备。它对数据分析的贡献很小。pandas解决了这个问题。使用 Pandas,我们可以完成数据处理和分析的五个典型步骤,无论数据来源如何——加载、准备、操作、建模和分析。
Python with Pandas 广泛应用于学术和商业领域,包括金融、经济、统计、分析等。
pandas的主要特征
- 快速高效的 DataFrame 对象,具有默认和自定义索引。
- 用于将数据从不同文件格式加载到内存中数据对象的工具。
- 数据对齐和缺失数据的综合处理。
- 日期集的重塑和旋转。
- 大型数据集基于标签的切片、索引和子集化。
- 可以删除或插入数据结构中的列。
- 按数据分组以进行聚合和转换。
- 高性能数据合并和连接。
- 时间序列功能。
Python Pandas - 环境设置
标准 Python 发行版不与 Pandas 模块捆绑在一起。一个轻量级的替代方案是使用流行的 Python 包安装程序pip 安装 NumPy。
pip install pandas
如果您安装 Anaconda Python 包,Pandas 将默认安装,并包含以下内容 -
Windows
Anaconda(来自https://www.continuum.io)是 SciPy 堆栈的免费 Python 发行版。它还适用于 Linux 和 Mac。
Canopy ( https://www.enthought.com/products/canopy/ ) 既可以免费提供,也可以作为商业发行版提供,具有适用于 Windows、Linux 和 Mac 的完整 SciPy 堆栈。
Python (x,y) 是一个免费的 Python 发行版,带有适用于 Windows 操作系统的 SciPy 堆栈和 Spyder IDE。(可从http://python-xy.github.io/下载)
Linux
各个 Linux 发行版的包管理器用于在 SciPy 堆栈中安装一个或多个包。
对于 Ubuntu 用户
sudo apt-get install python-numpy python-scipy python-matplotlibipythonipythonnotebook
python-pandas python-sympy python-nose
对于 Fedora 用户
sudo yum install numpyscipy python-matplotlibipython python-pandas sympy
python-nose atlas-devel
数据结构简介
Pandas 处理以下三种数据结构 -
- 系列
- 数据框
- 控制板
这些数据结构构建在 Numpy 数组之上,这意味着它们速度很快。
尺寸及描述
考虑这些数据结构的最佳方式是,高维数据结构是其低维数据结构的容器。例如DataFrame是Series的容器,Panel是DataFrame的容器。
| 数据结构 | 方面 | 描述 |
|---|---|---|
| 系列 | 1 | 一维标记同质数组,大小不可变。 |
| 数据框 | 2 | 一般二维标记、尺寸可变的表格结构,具有潜在的异构类型列。 |
| 控制板 | 3 | 通用 3D 标记、大小可变数组。 |
构建和处理二维或多维数组是一项繁琐的任务,用户在编写函数时需要考虑数据集的方向。但使用 Pandas 数据结构,可以减少用户的脑力劳动。
例如,对于表格数据 (DataFrame),考虑索引(行)和列而不是轴 0 和轴 1 在语义上更有帮助。
可变性
所有 Pandas 数据结构的值都是可变的(可以更改),除了 Series 之外,所有数据结构的大小都是可变的。系列的大小是不可变的。
注意- DataFrame 被广泛使用,并且是最重要的数据结构之一。面板的使用量要少得多。
系列
系列是具有同质数据的一维数组状结构。例如,以下系列是整数 10、23、56、... 的集合
| 10 | 23 | 56 | 17 号 | 52 | 61 | 73 | 90 | 26 | 72 |
关键点
- 数据同质
- 大小不可变
- 数据可变的值
数据框
DataFrame是一个具有异构数据的二维数组。例如,
| 姓名 | 年龄 | 性别 | 评分 |
|---|---|---|---|
| 史蒂夫 | 32 | 男性 | 3.45 |
| 利亚 | 28 | 女性 | 4.6 |
| 文号 | 45 | 男性 | 3.9 |
| 凯蒂 | 38 | 女性 | 2.78 |
该表表示组织销售团队的数据及其总体绩效评级。数据以行和列表示。每列代表一个属性,每行代表一个人。
列的数据类型
四列的数据类型如下 -
| 柱子 | 类型 |
|---|---|
| 姓名 | 细绳 |
| 年龄 | 整数 |
| 性别 | 细绳 |
| 评分 | 漂浮 |
关键点
- 异构数据
- 尺寸可变
- 数据可变
控制板
面板是一种数据异构的三维数据结构。很难用图形表示来表示面板。但面板可以被说明为 DataFrame 的容器。
关键点
- 异构数据
- 尺寸可变
- 数据可变
Python pandas - 系列
Series 是一个一维标记数组,能够保存任何类型的数据(整数、字符串、浮点数、Python 对象等)。轴标签统称为索引。
pandas系列
可以使用以下构造函数创建 pandas 系列 -
pandas.Series( data, index, dtype, copy)
构造函数的参数如下 -
| 先生编号 | 参数及说明 |
|---|---|
| 1 |
数据 数据有多种形式,如 ndarray、列表、常量 |
| 2 |
指数 索引值必须是唯一的且可散列的,并且与数据的长度相同。如果没有传递索引,则默认np.arange(n) 。 |
| 3 |
数据类型 dtype 是数据类型。如果没有,将推断数据类型 |
| 4 |
复制 复制数据。默认 False |
可以使用各种输入创建一个系列,例如 -
- 大批
- 词典
- 标量值或常数
创建一个空系列
可以创建的基本系列是空系列。
例子
#import the pandas library and aliasing as pd
import pandas as pd
s = pd.Series()
print s
其输出如下 -
Series([], dtype: float64)
从 ndarray 创建一个系列
如果数据是 ndarray,则传递的索引必须具有相同的长度。如果没有传递索引,则默认索引将为range(n),其中n是数组长度,即 [0,1,2,3…。范围(len(数组))-1]。
实施例1
#import the pandas library and aliasing as pd
import pandas as pd
import numpy as np
data = np.array(['a','b','c','d'])
s = pd.Series(data)
print s
其输出如下 -
0   a
1   b
2   c
3   d
dtype: object
我们没有传递任何索引,因此默认情况下,它分配的索引范围为 0 到len(data)-1,即 0 到 3。
实施例2
#import the pandas library and aliasing as pd
import pandas as pd
import numpy as np
data = np.array(['a','b','c','d'])
s = pd.Series(data,index=[100,101,102,103])
print s
其输出如下 -
100  a
101  b
102  c
103  d
dtype: object
我们在这里传递了索引值。现在我们可以在输出中看到自定义的索引值。
从 dict 创建一个系列
可以将字典作为输入传递,如果未指定索引,则按排序顺序获取字典键来构造索引。如果传递index,则会拉出index中标签对应的data中的值。
实施例1
#import the pandas library and aliasing as pd
import pandas as pd
import numpy as np
data = {'a' : 0., 'b' : 1., 'c' : 2.}
s = pd.Series(data)
print s
其输出如下 -
a 0.0
b 1.0
c 2.0
dtype: float64
观察- 字典键用于构造索引。
实施例2
#import the pandas library and aliasing as pd
import pandas as pd
import numpy as np
data = {'a' : 0., 'b' : 1., 'c' : 2.}
s = pd.Series(data,index=['b','c','d','a'])
print s
其输出如下 -
b 1.0
c 2.0
d NaN
a 0.0
dtype: float64
观察- 索引顺序保持不变,缺失的元素用 NaN(不是数字)填充。
从标量创建系列
如果数据是标量值,则必须提供索引。该值将重复以匹配索引的长度
#import the pandas library and aliasing as pd
import pandas as pd
import numpy as np
s = pd.Series(5, index=[0, 1, 2, 3])
print s
其输出如下 -
0  5
1  5
2  5
3  5
dtype: int64
访问带有位置的系列数据
该系列中的数据的访问方式与 ndarray 中的数据类似。
实施例1
检索第一个元素。我们已经知道,数组从零开始计数,这意味着第一个元素存储在第零个位置,依此类推。
import pandas as pd
s = pd.Series([1,2,3,4,5],index = ['a','b','c','d','e'])

#retrieve the first element
print s[0]
其输出如下 -
1
实施例2
检索系列中的前三个元素。如果在其前面插入 :,则将从该索引开始的所有项目都将被提取。如果使用两个参数(中间有:),则两个索引之间的项目(不包括停止索引)
import pandas as pd
s = pd.Series([1,2,3,4,5],index = ['a','b','c','d','e'])

#retrieve the first three element
print s[:3]
其输出如下 -
a  1
b  2
c  3
dtype: int64
实施例3
检索最后三个元素。
import pandas as pd
s = pd.Series([1,2,3,4,5],index = ['a','b','c','d','e'])

#retrieve the last three element
print s[-3:]
其输出如下 -
c  3
d  4
e  5
dtype: int64
使用标签(索引)检索数据
Series 就像一个固定大小的字典,您可以通过索引标签获取和设置值。
实施例1
使用索引标签值检索单个元素。
import pandas as pd
s = pd.Series([1,2,3,4,5],index = ['a','b','c','d','e'])

#retrieve a single element
print s['a']
其输出如下 -
1
实施例2
使用索引标签值列表检索多个元素。
import pandas as pd
s = pd.Series([1,2,3,4,5],index = ['a','b','c','d','e'])

#retrieve multiple elements
print s[['a','c','d']]
其输出如下 -
a  1
c  3
d  4
dtype: int64
实施例3
如果未包含标签,则会引发异常。
import pandas as pd
s = pd.Series([1,2,3,4,5],index = ['a','b','c','d','e'])

#retrieve multiple elements
print s['f']
其输出如下 -
…
KeyError: 'f'
Python Pandas - 数据帧
数据框是二维数据结构,即数据以表格方式按行和列对齐。
数据框的特点
- 列可能具有不同类型
- 大小 – 可变
- 带标签的轴(行和列)
- 可以对行和列执行算术运算
结构
假设我们正在使用学生的数据创建一个数据框。
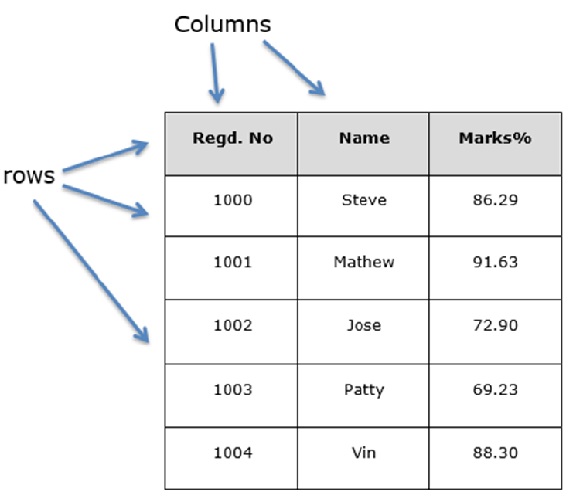
您可以将其视为 SQL 表或电子表格数据表示形式。
pandas.DataFrame
可以使用以下构造函数创建 pandas DataFrame -
pandas.DataFrame( data, index, columns, dtype, copy)
构造函数的参数如下 -
| 先生编号 | 参数及说明 |
|---|---|
| 1 |
数据 数据有多种形式,如 ndarray、series、map、lists、dict、constants 以及另一个 DataFrame。 |
| 2 |
指数 对于行标签,如果没有传递索引,则用于结果帧的索引是可选默认值 np.arange(n) 。 |
| 3 |
列 对于列标签,可选的默认语法是 - np.arange(n)。仅当未传递索引时才如此。 |
| 4 |
数据类型 每列的数据类型。 |
| 5 |
复制 如果默认值为 False,则此命令(或其他任何命令)用于复制数据。 |
创建数据框
可以使用各种输入创建 pandas DataFrame,例如 -
- 列表
- 词典
- 系列
- Numpy ndarrays
- 另一个数据框
在本章的后续部分中,我们将了解如何使用这些输入创建 DataFrame。
创建一个空数据框
可以创建的基本数据框是空数据框。
例子
#import the pandas library and aliasing as pd
import pandas as pd
df = pd.DataFrame()
print df
其输出如下 -
Empty DataFrame
Columns: []
Index: []
从列表创建数据框
可以使用单个列表或列表列表来创建 DataFrame。
实施例1
import pandas as pd
data = [1,2,3,4,5]
df = pd.DataFrame(data)
print df
其输出如下 -
     0
0    1
1    2
2    3
3    4
4    5
实施例2
import pandas as pd
data = [['Alex',10],['Bob',12],['Clarke',13]]
df = pd.DataFrame(data,columns=['Name','Age'])
print df
其输出如下 -
      Name      Age
0     Alex      10
1     Bob       12
2     Clarke    13
实施例3
import pandas as pd
data = [['Alex',10],['Bob',12],['Clarke',13]]
df = pd.DataFrame(data,columns=['Name','Age'],dtype=float)
print df
其输出如下 -
      Name     Age
0     Alex     10.0
1     Bob      12.0
2     Clarke   13.0
注意- 观察dtype参数将 Age 列的类型更改为浮点。
从 ndarrays / 列表的字典创建 DataFrame
所有ndarray 的长度必须相同。如果传递索引,则索引的长度应等于数组的长度。
如果没有传递索引,则默认情况下索引将为 range(n),其中n是数组长度。
实施例1
import pandas as pd
data = {'Name':['Tom', 'Jack', 'Steve', 'Ricky'],'Age':[28,34,29,42]}
df = pd.DataFrame(data)
print df
其输出如下 -
      Age      Name
0     28        Tom
1     34       Jack
2     29      Steve
3     42      Ricky
注意- 观察值 0、1、2、3。它们是使用函数 range(n) 分配给每个的默认索引。
实施例2
现在让我们使用数组创建一个索引 DataFrame。
import pandas as pd
data = {'Name':['Tom', 'Jack', 'Steve', 'Ricky'],'Age':[28,34,29,42]}
df = pd.DataFrame(data, index=['rank1','rank2','rank3','rank4'])
print df
其输出如下 -
         Age    Name
rank1    28      Tom
rank2    34     Jack
rank3    29    Steve
rank4    42    Ricky
注意- 观察,索引参数为每行分配一个索引。
从字典列表创建数据框
字典列表可以作为输入数据传递以创建 DataFrame。默认情况下,字典键被视为列名。
实施例1
以下示例演示如何通过传递字典列表来创建 DataFrame。
import pandas as pd
data = [{'a': 1, 'b': 2},{'a': 5, 'b': 10, 'c': 20}]
df = pd.DataFrame(data)
print df
其输出如下 -
    a    b      c
0   1   2     NaN
1   5   10   20.0
注意- 观察,NaN(不是数字)被附加在缺失的区域中。
实施例2
以下示例演示如何通过传递字典列表和行索引来创建 DataFrame。
import pandas as pd
data = [{'a': 1, 'b': 2},{'a': 5, 'b': 10, 'c': 20}]
df = pd.DataFrame(data, index=['first', 'second'])
print df
其输出如下 -
        a   b       c
first   1   2     NaN
second  5   10   20.0
实施例3
以下示例演示如何创建包含字典、行索引和列索引列表的 DataFrame。
import pandas as pd
data = [{'a': 1, 'b': 2},{'a': 5, 'b': 10, 'c': 20}]

#With two column indices, values same as dictionary keys
df1 = pd.DataFrame(data, index=['first', 'second'], columns=['a', 'b'])

#With two column indices with one index with other name
df2 = pd.DataFrame(data, index=['first', 'second'], columns=['a', 'b1'])
print df1
print df2
其输出如下 -
#df1 output
         a  b
first    1  2
second   5  10

#df2 output
         a  b1
first    1  NaN
second   5  NaN
注意- 观察,df2 DataFrame 是使用字典键以外的列索引创建的;因此,附加了 NaN。而 df1 是使用与字典键相同的列索引创建的,因此附加了 NaN。
从系列字典创建数据框
可以传递系列字典以形成数据帧。结果索引是所有传递的系列索引的并集。
例子
import pandas as pd

d = {'one' : pd.Series([1, 2, 3], index=['a', 'b', 'c']),
   'two' : pd.Series([1, 2, 3, 4], index=['a', 'b', 'c', 'd'])}

df = pd.DataFrame(d)
print df
其输出如下 -
      one    two
a     1.0    1
b     2.0    2
c     3.0    3
d     NaN    4
注意- 观察到,对于系列一,没有传递标签“d”,但在结果中,对于d标签,NaN 附加了 NaN。
现在让我们通过示例来了解列的选择、添加和删除。
色谱柱选择
我们将通过从 DataFrame 中选择一列来理解这一点。
例子
import pandas as pd

d = {'one' : pd.Series([1, 2, 3], index=['a', 'b', 'c']),
   'two' : pd.Series([1, 2, 3, 4], index=['a', 'b', 'c', 'd'])}

df = pd.DataFrame(d)
print df ['one']
其输出如下 -
a     1.0
b     2.0
c     3.0
d     NaN
Name: one, dtype: float64
列添加
我们将通过向现有数据框添加新列来理解这一点。
例子
import pandas as pd

d = {'one' : pd.Series([1, 2, 3], index=['a', 'b', 'c']),
   'two' : pd.Series([1, 2, 3, 4], index=['a', 'b', 'c', 'd'])}

df = pd.DataFrame(d)

# Adding a new column to an existing DataFrame object with column label by passing new series

print ("Adding a new column by passing as Series:")
df['three']=pd.Series([10,20,30],index=['a','b','c'])
print df

print ("Adding a new column using the existing columns in DataFrame:")
df['four']=df['one']+df['three']

print df
其输出如下 -
Adding a new column by passing as Series:
     one   two   three
a    1.0    1    10.0
b    2.0    2    20.0
c    3.0    3    30.0
d    NaN    4    NaN

Adding a new column using the existing columns in DataFrame:
      one   two   three    four
a     1.0    1    10.0     11.0
b     2.0    2    20.0     22.0
c     3.0    3    30.0     33.0
d     NaN    4     NaN     NaN
列删除
列可以被删除或弹出;让我们举个例子来理解如何做到这一点。
例子
# Using the previous DataFrame, we will delete a column
# using del function
import pandas as pd

d = {'one' : pd.Series([1, 2, 3], index=['a', 'b', 'c']),
   'two' : pd.Series([1, 2, 3, 4], index=['a', 'b', 'c', 'd']),
   'three' : pd.Series([10,20,30], index=['a','b','c'])}

df = pd.DataFrame(d)
print ("Our dataframe is:")
print df

# using del function
print ("Deleting the first column using DEL function:")
del df['one']
print df

# using pop function
print ("Deleting another column using POP function:")
df.pop('two')
print df
其输出如下 -
Our dataframe is:
      one   three  two
a     1.0    10.0   1
b     2.0    20.0   2
c     3.0    30.0   3
d     NaN     NaN   4

Deleting the first column using DEL function:
      three    two
a     10.0     1
b     20.0     2
c     30.0     3
d     NaN      4

Deleting another column using POP function:
   three
a  10.0
b  20.0
c  30.0
d  NaN
行选择、添加和删除
现在我们将通过示例来了解行选择、添加和删除。让我们从选择的概念开始。
按标签选择
可以通过将行标签传递给loc函数来选择行。
import pandas as pd

d = {'one' : pd.Series([1, 2, 3], index=['a', 'b', 'c']),
   'two' : pd.Series([1, 2, 3, 4], index=['a', 'b', 'c', 'd'])}

df = pd.DataFrame(d)
print df.loc['b']
其输出如下 -
one 2.0
two 2.0
Name: b, dtype: float64
结果是一系列标签作为 DataFrame 的列名称。并且,该系列的名称是检索该系列的标签。
按整数位置选择
可以通过将整数位置传递给iloc函数来选择行。
import pandas as pd

d = {'one' : pd.Series([1, 2, 3], index=['a', 'b', 'c']),
   'two' : pd.Series([1, 2, 3, 4], index=['a', 'b', 'c', 'd'])}

df = pd.DataFrame(d)
print df.iloc[2]
其输出如下 -
one   3.0
two   3.0
Name: c, dtype: float64
切片行
可以使用“:”运算符选择多行。
import pandas as pd

d = {'one' : pd.Series([1, 2, 3], index=['a', 'b', 'c']),
   'two' : pd.Series([1, 2, 3, 4], index=['a', 'b', 'c', 'd'])}

df = pd.DataFrame(d)
print df[2:4]
其输出如下 -
   one  two
c  3.0    3
d  NaN    4
添加行
使用追加函数将新行添加到 DataFrame 。此函数将在末尾追加行。
import pandas as pd

df = pd.DataFrame([[1, 2], [3, 4]], columns = ['a','b'])
df2 = pd.DataFrame([[5, 6], [7, 8]], columns = ['a','b'])

df = df.append(df2)
print df
其输出如下 -
   a  b
0  1  2
1  3  4
0  5  6
1  7  8
删除行
使用索引标签从 DataFrame 中删除或删除行。如果标签重复,则会删除多行。
如果您观察到,在上面的示例中,标签是重复的。让我们删除一个标签,看看将删除多少行。
import pandas as pd

df = pd.DataFrame([[1, 2], [3, 4]], columns = ['a','b'])
df2 = pd.DataFrame([[5, 6], [7, 8]], columns = ['a','b'])

df = df.append(df2)

# Drop rows with label 0
df = df.drop(0)

print df
其输出如下 -
  a b
1 3 4
1 7 8
在上面的示例中,删除了两行,因为这两行包含相同的标签 0。
Python Pandas - 面板
面板是数据的 3D 容器。术语“面板数据”源自计量经济学,部分原因是 pandas - pan(el)-da(ta) -s 这个名称。
3 个轴的名称旨在为描述涉及面板数据的操作提供一些语义含义。他们是 -
items - 轴 0,每个项目对应于其中包含的一个 DataFrame。
Major_axis - 轴 1,它是每个 DataFrame 的索引(行)。
minor_axis - 轴 2,它是每个 DataFrame 的列。
pandas.Panel()
可以使用以下构造函数创建面板 -
pandas.Panel(data, items, major_axis, minor_axis, dtype, copy)
构造函数的参数如下 -
| 范围 | 描述 |
|---|---|
| 数据 | 数据采用多种形式,例如 ndarray、series、map、lists、dict、constants 以及另一个 DataFrame |
| 项目 | 轴=0 |
| 长轴 | 轴=1 |
| 短轴 | 轴=2 |
| 数据类型 | 每列的数据类型 |
| 复制 | 复制数据。默认,假 |
创建面板
可以使用多种方式创建面板,例如 -
- 来自 ndarrays
- 来自 DataFrames 的字典
来自 3D ndarray
# creating an empty panel
import pandas as pd
import numpy as np

data = np.random.rand(2,4,5)
p = pd.Panel(data)
print p
其输出如下 -
<class 'pandas.core.panel.Panel'>
Dimensions: 2 (items) x 4 (major_axis) x 5 (minor_axis)
Items axis: 0 to 1
Major_axis axis: 0 to 3
Minor_axis axis: 0 to 4
注意- 观察空面板和上面面板的尺寸,所有对象都是不同的。
来自 DataFrame 对象的字典
#creating an empty panel
import pandas as pd
import numpy as np

data = {'Item1' : pd.DataFrame(np.random.randn(4, 3)),
   'Item2' : pd.DataFrame(np.random.randn(4, 2))}
p = pd.Panel(data)
print p
其输出如下 -
Dimensions: 2 (items) x 4 (major_axis) x 3 (minor_axis)
Items axis: Item1 to Item2
Major_axis axis: 0 to 3
Minor_axis axis: 0 to 2
创建一个空面板
可以使用面板构造函数创建一个空面板,如下所示 -
#creating an empty panel
import pandas as pd
p = pd.Panel()
print p
其输出如下 -
<class 'pandas.core.panel.Panel'>
Dimensions: 0 (items) x 0 (major_axis) x 0 (minor_axis)
Items axis: None
Major_axis axis: None
Minor_axis axis: None
从面板中选择数据
使用从面板中选择数据 -
- 项目
- 长轴
- 短轴
使用物品
# creating an empty panel
import pandas as pd
import numpy as np
data = {'Item1' : pd.DataFrame(np.random.randn(4, 3)),
   'Item2' : pd.DataFrame(np.random.randn(4, 2))}
p = pd.Panel(data)
print p['Item1']
其输出如下 -
            0          1          2
0    0.488224  -0.128637   0.930817
1    0.417497   0.896681   0.576657
2   -2.775266   0.571668   0.290082
3   -0.400538  -0.144234   1.110535
我们有两个项目,并且检索了项目 1。结果是一个具有 4 行和 3 列的 DataFrame,它们是Major_axis和Minor_axis维度。
使用major_axis
可以使用方法panel.major_axis(index)访问数据。
# creating an empty panel
import pandas as pd
import numpy as np
data = {'Item1' : pd.DataFrame(np.random.randn(4, 3)),
   'Item2' : pd.DataFrame(np.random.randn(4, 2))}
p = pd.Panel(data)
print p.major_xs(1)
其输出如下 -
      Item1       Item2
0   0.417497    0.748412
1   0.896681   -0.557322
2   0.576657       NaN
使用minor_axis
可以使用方法 panel.minor_axis(index) 访问数据。
# creating an empty panel
import pandas as pd
import numpy as np
data = {'Item1' : pd.DataFrame(np.random.randn(4, 3)),
   'Item2' : pd.DataFrame(np.random.randn(4, 2))}
p = pd.Panel(data)
print p.minor_xs(1)
其输出如下 -
       Item1       Item2
0   -0.128637   -1.047032
1    0.896681   -0.557322
2    0.571668    0.431953
3   -0.144234    1.302466
注意- 观察尺寸的变化。
Python Pandas - 基本功能
到目前为止,我们已经了解了 Pandas 的三种数据结构以及如何创建它们。我们将主要关注 DataFrame 对象,因为它在实时数据处理中的重要性,并讨论一些其他 DataStructures。
系列基本功能
| 先生。 | 属性或方法及描述 |
|---|---|
| 1 |
轴 返回行轴标签的列表 |
| 2 |
数据类型 返回对象的数据类型。 |
| 3 |
空的 如果系列为空,则返回 True。 |
| 4 |
恩迪姆 根据定义 1,返回基础数据的维数。 |
| 5 |
尺寸 返回基础数据中的元素数量。 |
| 6 |
价值观 以 ndarray 形式返回系列。 |
| 7 |
头() 返回前 n 行。 |
| 8 |
尾巴() 返回最后 n 行。 |
现在让我们创建一个系列并查看上面列出的所有属性操作。
例子
import pandas as pd
import numpy as np

#Create a series with 100 random numbers
s = pd.Series(np.random.randn(4))
print s
其输出如下 -
0   0.967853
1  -0.148368
2  -1.395906
3  -1.758394
dtype: float64
轴
返回该系列的标签列表。
import pandas as pd
import numpy as np

#Create a series with 100 random numbers
s = pd.Series(np.random.randn(4))
print ("The axes are:")
print s.axes
其输出如下 -
The axes are:
[RangeIndex(start=0, stop=4, step=1)]
上面的结果是从 0 到 5 的值列表的紧凑格式,即 [0,1,2,3,4]。
空的
返回表示对象是否为空的布尔值。True 表示该对象为空。
import pandas as pd
import numpy as np

#Create a series with 100 random numbers
s = pd.Series(np.random.randn(4))
print ("Is the Object empty?")
print s.empty
其输出如下 -
Is the Object empty?
False
恩迪姆
返回对象的维数。根据定义,Series 是一维数据结构,因此它返回
import pandas as pd
import numpy as np

#Create a series with 4 random numbers
s = pd.Series(np.random.randn(4))
print s

print ("The dimensions of the object:")
print s.ndim
其输出如下 -
0   0.175898
1   0.166197
2  -0.609712
3  -1.377000
dtype: float64

The dimensions of the object:
1
尺寸
返回系列的大小(长度)。
import pandas as pd
import numpy as np

#Create a series with 4 random numbers
s = pd.Series(np.random.randn(2))
print s
print ("The size of the object:")
print s.size
其输出如下 -
0   3.078058
1  -1.207803
dtype: float64

The size of the object:
2
价值观
以数组形式返回系列中的实际数据。
import pandas as pd
import numpy as np

#Create a series with 4 random numbers
s = pd.Series(np.random.randn(4))
print s

print ("The actual data series is:")
print s.values
其输出如下 -
0   1.787373
1  -0.605159
2   0.180477
3  -0.140922
dtype: float64

The actual data series is:
[ 1.78737302 -0.60515881 0.18047664 -0.1409218 ]
头尾
要查看 Series 或 DataFrame 对象的小样本,请使用 head() 和 tail() 方法。
head()返回前n行(观察索引值)。要显示的默认元素数量为 5,但您可以传递自定义数量。
import pandas as pd
import numpy as np

#Create a series with 4 random numbers
s = pd.Series(np.random.randn(4))
print ("The original series is:")
print s

print ("The first two rows of the data series:")
print s.head(2)
其输出如下 -
The original series is:
0   0.720876
1  -0.765898
2   0.479221
3  -0.139547
dtype: float64

The first two rows of the data series:
0   0.720876
1  -0.765898
dtype: float64
tail()返回最后n行(观察索引值)。要显示的默认元素数量为 5,但您可以传递自定义数量。
import pandas as pd
import numpy as np

#Create a series with 4 random numbers
s = pd.Series(np.random.randn(4))
print ("The original series is:")
print s

print ("The last two rows of the data series:")
print s.tail(2)
其输出如下 -
The original series is:
0 -0.655091
1 -0.881407
2 -0.608592
3 -2.341413
dtype: float64

The last two rows of the data series:
2 -0.608592
3 -2.341413
dtype: float64
数据框架基本功能
现在让我们了解什么是 DataFrame 基本功能。下表列出了有助于 DataFrame 基本功能的重要属性或方法。
| 先生。 | 属性或方法及描述 |
|---|---|
| 1 |
时间 转置行和列。 |
| 2 |
轴 返回一个列表,其中行轴标签和列轴标签作为唯一的成员。 |
| 3 |
数据类型 返回此对象中的数据类型。 |
| 4 |
空的 如果 NDFrame 完全为空 [无项目],则为 True;如果任何轴的长度为 0。 |
| 5 |
恩迪姆 轴数/数组维度。 |
| 6 |
形状 返回表示 DataFrame 维度的元组。 |
| 7 |
尺寸 NDFrame 中的元素数量。 |
| 8 |
价值观 NDFrame 的 Numpy 表示。 |
| 9 |
头() 返回前 n 行。 |
| 10 |
尾巴() 返回最后 n 行。 |
现在让我们创建一个 DataFrame 并看看上述属性是如何操作的。
例子
import pandas as pd
import numpy as np

#Create a Dictionary of series
d = {'Name':pd.Series(['Tom','James','Ricky','Vin','Steve','Smith','Jack']),
   'Age':pd.Series([25,26,25,23,30,29,23]),
   'Rating':pd.Series([4.23,3.24,3.98,2.56,3.20,4.6,3.8])}

#Create a DataFrame
df = pd.DataFrame(d)
print ("Our data series is:")
print df
其输出如下 -
Our data series is:
    Age   Name    Rating
0   25    Tom     4.23
1   26    James   3.24
2   25    Ricky   3.98
3   23    Vin     2.56
4   30    Steve   3.20
5   29    Smith   4.60
6   23    Jack    3.80
T(转置)
返回 DataFrame 的转置。行和列将互换。
import pandas as pd
import numpy as np

# Create a Dictionary of series
d = {'Name':pd.Series(['Tom','James','Ricky','Vin','Steve','Smith','Jack']),
   'Age':pd.Series([25,26,25,23,30,29,23]),
   'Rating':pd.Series([4.23,3.24,3.98,2.56,3.20,4.6,3.8])}

# Create a DataFrame
df = pd.DataFrame(d)
print ("The transpose of the data series is:")
print df.T
其输出如下 -
The transpose of the data series is:
         0     1       2      3      4      5       6
Age      25    26      25     23     30     29      23
Name     Tom   James   Ricky  Vin    Steve  Smith   Jack
Rating   4.23  3.24    3.98   2.56   3.2    4.6     3.8
轴
返回行轴标签和列轴标签的列表。
import pandas as pd
import numpy as np

#Create a Dictionary of series
d = {'Name':pd.Series(['Tom','James','Ricky','Vin','Steve','Smith','Jack']),
   'Age':pd.Series([25,26,25,23,30,29,23]),
   'Rating':pd.Series([4.23,3.24,3.98,2.56,3.20,4.6,3.8])}

#Create a DataFrame
df = pd.DataFrame(d)
print ("Row axis labels and column axis labels are:")
print df.axes
其输出如下 -
Row axis labels and column axis labels are:

[RangeIndex(start=0, stop=7, step=1), Index([u'Age', u'Name', u'Rating'],
dtype='object')]
数据类型
返回每列的数据类型。
import pandas as pd
import numpy as np

#Create a Dictionary of series
d = {'Name':pd.Series(['Tom','James','Ricky','Vin','Steve','Smith','Jack']),
   'Age':pd.Series([25,26,25,23,30,29,23]),
   'Rating':pd.Series([4.23,3.24,3.98,2.56,3.20,4.6,3.8])}

#Create a DataFrame
df = pd.DataFrame(d)
print ("The data types of each column are:")
print df.dtypes
其输出如下 -
The data types of each column are:
Age     int64
Name    object
Rating  float64
dtype: object
空的
返回布尔值,表示对象是否为空;True 表示该对象为空。
import pandas as pd
import numpy as np

#Create a Dictionary of series
d = {'Name':pd.Series(['Tom','James','Ricky','Vin','Steve','Smith','Jack']),
   'Age':pd.Series([25,26,25,23,30,29,23]),
   'Rating':pd.Series([4.23,3.24,3.98,2.56,3.20,4.6,3.8])}

#Create a DataFrame
df = pd.DataFrame(d)
print ("Is the object empty?")
print df.empty
其输出如下 -
Is the object empty?
False
恩迪姆
返回对象的维数。根据定义,DataFrame 是一个 2D 对象。
import pandas as pd
import numpy as np

#Create a Dictionary of series
d = {'Name':pd.Series(['Tom','James','Ricky','Vin','Steve','Smith','Jack']),
   'Age':pd.Series([25,26,25,23,30,29,23]),
   'Rating':pd.Series([4.23,3.24,3.98,2.56,3.20,4.6,3.8])}

#Create a DataFrame
df = pd.DataFrame(d)
print ("Our object is:")
print df
print ("The dimension of the object is:")
print df.ndim
其输出如下 -
Our object is:
      Age    Name     Rating
0     25     Tom      4.23
1     26     James    3.24
2     25     Ricky    3.98
3     23     Vin      2.56
4     30     Steve    3.20
5     29     Smith    4.60
6     23     Jack     3.80

The dimension of the object is:
2
形状
返回表示 DataFrame 维度的元组。元组(a,b),其中a代表行数,b代表列数。
import pandas as pd
import numpy as np

#Create a Dictionary of series
d = {'Name':pd.Series(['Tom','James','Ricky','Vin','Steve','Smith','Jack']),
   'Age':pd.Series([25,26,25,23,30,29,23]),
   'Rating':pd.Series([4.23,3.24,3.98,2.56,3.20,4.6,3.8])}

#Create a DataFrame
df = pd.DataFrame(d)
print ("Our object is:")
print df
print ("The shape of the object is:")
print df.shape
其输出如下 -
Our object is:
   Age   Name    Rating
0  25    Tom     4.23
1  26    James   3.24
2  25    Ricky   3.98
3  23    Vin     2.56
4  30    Steve   3.20
5  29    Smith   4.60
6  23    Jack    3.80

The shape of the object is:
(7, 3)
尺寸
返回 DataFrame 中的元素数量。
import pandas as pd
import numpy as np

#Create a Dictionary of series
d = {'Name':pd.Series(['Tom','James','Ricky','Vin','Steve','Smith','Jack']),
   'Age':pd.Series([25,26,25,23,30,29,23]),
   'Rating':pd.Series([4.23,3.24,3.98,2.56,3.20,4.6,3.8])}

#Create a DataFrame
df = pd.DataFrame(d)
print ("Our object is:")
print df
print ("The total number of elements in our object is:")
print df.size
其输出如下 -
Our object is:
    Age   Name    Rating
0   25    Tom     4.23
1   26    James   3.24
2   25    Ricky   3.98
3   23    Vin     2.56
4   30    Steve   3.20
5   29    Smith   4.60
6   23    Jack    3.80

The total number of elements in our object is:
21
价值观
以 NDarray 形式返回 DataFrame 中的实际数据。
import pandas as pd
import numpy as np

#Create a Dictionary of series
d = {'Name':pd.Series(['Tom','James','Ricky','Vin','Steve','Smith','Jack']),
   'Age':pd.Series([25,26,25,23,30,29,23]),
   'Rating':pd.Series([4.23,3.24,3.98,2.56,3.20,4.6,3.8])}

#Create a DataFrame
df = pd.DataFrame(d)
print ("Our object is:")
print df
print ("The actual data in our data frame is:")
print df.values
其输出如下 -
Our object is:
    Age   Name    Rating
0   25    Tom     4.23
1   26    James   3.24
2   25    Ricky   3.98
3   23    Vin     2.56
4   30    Steve   3.20
5   29    Smith   4.60
6   23    Jack    3.80
The actual data in our data frame is:
[[25 'Tom' 4.23]
[26 'James' 3.24]
[25 'Ricky' 3.98]
[23 'Vin' 2.56]
[30 'Steve' 3.2]
[29 'Smith' 4.6]
[23 'Jack' 3.8]]
头尾
要查看 DataFrame 对象的小样本,请使用head()和 tail() 方法。head()返回前n行(观察索引值)。要显示的默认元素数量为 5,但您可以传递自定义数量。
import pandas as pd
import numpy as np

#Create a Dictionary of series
d = {'Name':pd.Series(['Tom','James','Ricky','Vin','Steve','Smith','Jack']),
   'Age':pd.Series([25,26,25,23,30,29,23]),
   'Rating':pd.Series([4.23,3.24,3.98,2.56,3.20,4.6,3.8])}

#Create a DataFrame
df = pd.DataFrame(d)
print ("Our data frame is:")
print df
print ("The first two rows of the data frame is:")
print df.head(2)
其输出如下 -
Our data frame is:
    Age   Name    Rating
0   25    Tom     4.23
1   26    James   3.24
2   25    Ricky   3.98
3   23    Vin     2.56
4   30    Steve   3.20
5   29    Smith   4.60
6   23    Jack    3.80

The first two rows of the data frame is:
   Age   Name   Rating
0  25    Tom    4.23
1  26    James  3.24
tail()返回最后n行(观察索引值)。要显示的默认元素数量为 5,但您可以传递自定义数量。
import pandas as pd
import numpy as np

#Create a Dictionary of series
d = {'Name':pd.Series(['Tom','James','Ricky','Vin','Steve','Smith','Jack']),
   'Age':pd.Series([25,26,25,23,30,29,23]),
   'Rating':pd.Series([4.23,3.24,3.98,2.56,3.20,4.6,3.8])}

#Create a DataFrame
df = pd.DataFrame(d)
print ("Our data frame is:")
print df
print ("The last two rows of the data frame is:")
print df.tail(2)
其输出如下 -
Our data frame is:
    Age   Name    Rating
0   25    Tom     4.23
1   26    James   3.24
2   25    Ricky   3.98
3   23    Vin     2.56
4   30    Steve   3.20
5   29    Smith   4.60
6   23    Jack    3.80

The last two rows of the data frame is:
    Age   Name    Rating
5   29    Smith    4.6
6   23    Jack     3.8
Python Pandas - 描述性统计
大量方法共同计算 DataFrame 上的描述性统计数据和其他相关操作。其中大多数是聚合,如sum()、mean(),但其中一些(如sumsum())会生成相同大小的对象。一般来说,这些方法采用轴参数,就像ndarray.{sum, std, ...} 一样,但轴可以通过名称或整数指定
DataFrame - “索引”(轴=0,默认),“列”(轴=1)
让我们创建一个 DataFrame 并在本章中使用该对象进行所有操作。
例子
import pandas as pd
import numpy as np

#Create a Dictionary of series
d = {'Name':pd.Series(['Tom','James','Ricky','Vin','Steve','Smith','Jack',
   'Lee','David','Gasper','Betina','Andres']),
   'Age':pd.Series([25,26,25,23,30,29,23,34,40,30,51,46]),
   'Rating':pd.Series([4.23,3.24,3.98,2.56,3.20,4.6,3.8,3.78,2.98,4.80,4.10,3.65])
}

#Create a DataFrame
df = pd.DataFrame(d)
print df
其输出如下 -
    Age  Name   Rating
0   25   Tom     4.23
1   26   James   3.24
2   25   Ricky   3.98
3   23   Vin     2.56
4   30   Steve   3.20
5   29   Smith   4.60
6   23   Jack    3.80
7   34   Lee     3.78
8   40   David   2.98
9   30   Gasper  4.80
10  51   Betina  4.10
11  46   Andres  3.65
和()
返回所请求轴的值的总和。默认情况下,轴为索引(axis=0)。
import pandas as pd
import numpy as np

#Create a Dictionary of series
d = {'Name':pd.Series(['Tom','James','Ricky','Vin','Steve','Smith','Jack',
   'Lee','David','Gasper','Betina','Andres']),
   'Age':pd.Series([25,26,25,23,30,29,23,34,40,30,51,46]),
   'Rating':pd.Series([4.23,3.24,3.98,2.56,3.20,4.6,3.8,3.78,2.98,4.80,4.10,3.65])
}

#Create a DataFrame
df = pd.DataFrame(d)
print df.sum()
其输出如下 -
Age                                                    382
Name     TomJamesRickyVinSteveSmithJackLeeDavidGasperBe...
Rating                                               44.92
dtype: object
每个单独的列都是单独添加的(附加字符串)。
轴=1
此语法将给出如下所示的输出。
import pandas as pd
import numpy as np

#Create a Dictionary of series
d = {'Name':pd.Series(['Tom','James','Ricky','Vin','Steve','Smith','Jack',
   'Lee','David','Gasper','Betina','Andres']),
   'Age':pd.Series([25,26,25,23,30,29,23,34,40,30,51,46]),
   'Rating':pd.Series([4.23,3.24,3.98,2.56,3.20,4.6,3.8,3.78,2.98,4.80,4.10,3.65])
}

#Create a DataFrame
df = pd.DataFrame(d)
print df.sum(1)
其输出如下 -
0    29.23
1    29.24
2    28.98
3    25.56
4    33.20
5    33.60
6    26.80
7    37.78
8    42.98
9    34.80
10   55.10
11   49.65
dtype: float64
意思是()
返回平均值
import pandas as pd
import numpy as np

#Create a Dictionary of series
d = {'Name':pd.Series(['Tom','James','Ricky','Vin','Steve','Smith','Jack',
   'Lee','David','Gasper','Betina','Andres']),
   'Age':pd.Series([25,26,25,23,30,29,23,34,40,30,51,46]),
   'Rating':pd.Series([4.23,3.24,3.98,2.56,3.20,4.6,3.8,3.78,2.98,4.80,4.10,3.65])
}

#Create a DataFrame
df = pd.DataFrame(d)
print df.mean()
其输出如下 -
Age       31.833333
Rating     3.743333
dtype: float64
标准()
返回数值列的布雷塞尔标准差。