- Bokeh教程
- Bokeh - 主页
- Bokeh - 简介
- Bokeh - 环境设置
- Bokeh - 入门
- Bokeh - Jupyter Notebook
- Bokeh - 基本概念
- Bokeh - 带字形的图
- Bokeh - 面积图
- Bokeh - 圆形字形
- Bokeh - 矩形、椭圆形和多边形
- Bokeh - 楔形和弧形
- Bokeh - 专业曲线
- Bokeh - 设置范围
- Bokeh - 轴
- Bokeh - 注释和图例
- Bokeh - pandas
- Bokeh - ColumnDataSource
- Bokeh - 过滤数据
- Bokeh - 布局
- Bokeh - 绘图工具
- Bokeh - 视觉属性样式
- Bokeh - 自定义图例
- Bokeh - 添加小部件
- Bokeh - 服务器
- Bokeh - 使用 Bokeh 子命令
- Bokeh - 导出图
- Bokeh - 嵌入图和应用程序
- Bokeh - 扩展Bokeh
- Bokeh - WebGL
- Bokeh - 使用 JavaScript 进行开发
- Bokeh有用资源
- Bokeh - 快速指南
- Bokeh - 有用的资源
- Bokeh - 讨论
Bokeh - 布局
Bokeh可视化可以适当地安排在不同的布局选项中。这些布局以及大小调整模式会导致绘图和小部件根据浏览器窗口的大小自动调整大小。为了保持外观一致,布局中的所有项目必须具有相同的大小调整模式。小部件(按钮、菜单等)保存在单独的小部件框中,而不是在图中。
第一种布局是列布局,它垂直显示绘图。column () 函数在bokeh.layouts模块中定义,并采用以下签名 -
from bokeh.layouts import column
col = column(children, sizing_mode)
Children - 绘图和/或小部件列表。
sizing_mode - 确定布局中的项目如何调整大小。可能的值为“fixed”、“stretch_both”、“scale_width”、“scale_height”、“scale_both”。默认为“固定”。
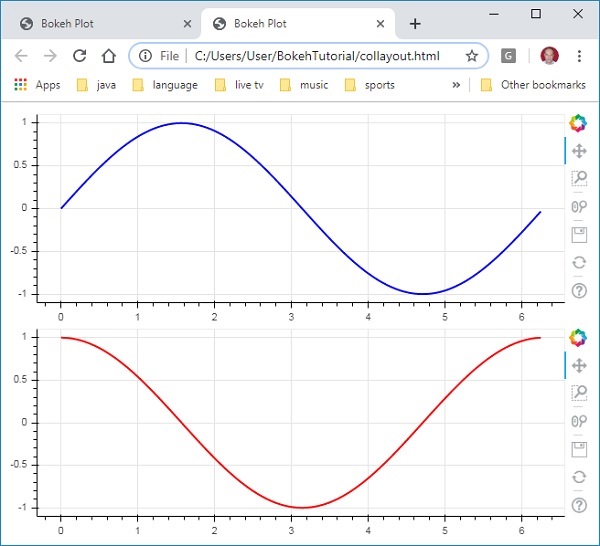
以下代码生成两个Bokeh图并将它们放置在列布局中,以便它们垂直显示。每个图中都显示了表示 x 和 y 数据系列之间的正弦和余弦关系的线字形。
from bokeh.plotting import figure, output_file, show
from bokeh.layouts import column
import numpy as np
import math
x = np.arange(0, math.pi*2, 0.05)
y1 = np.sin(x)
y2 = np.cos(x)
fig1 = figure(plot_width = 200, plot_height = 200)
fig1.line(x, y1,line_width = 2, line_color = 'blue')
fig2 = figure(plot_width = 200, plot_height = 200)
fig2.line(x, y2,line_width = 2, line_color = 'red')
c = column(children = [fig1, fig2], sizing_mode = 'stretch_both')
show(c)
输出
类似地,行布局水平排列绘图,使用 bokeh.layouts 模块中定义的row() 函数。正如您所想,它还需要两个参数(类似于column()函数)——children和sizing_mode。
上图中垂直显示的正弦和余弦曲线现在通过以下代码在行布局中水平显示
from bokeh.plotting import figure, output_file, show
from bokeh.layouts import row
import numpy as np
import math
x = np.arange(0, math.pi*2, 0.05)
y1 = np.sin(x)
y2 = np.cos(x)
fig1 = figure(plot_width = 200, plot_height = 200)
fig1.line(x, y1,line_width = 2, line_color = 'blue')
fig2 = figure(plot_width = 200, plot_height = 200)
fig2.line(x, y2,line_width = 2, line_color = 'red')
r = row(children = [fig1, fig2], sizing_mode = 'stretch_both')
show(r)
输出

Bokeh 包也有网格布局。它在行和列的二维网格中包含多个绘图图形(以及小部件)。bokeh.layouts 模块中的gridplot () 函数返回一个网格和一个统一的工具栏,可以借助 Toolbar_location 属性来定位该工具栏。
这与行或列布局不同,在行或列布局中,每个图都显示自己的工具栏。grid() 函数也使用children 和sizing_mode 参数,其中children 是列表的列表。确保每个子列表具有相同的尺寸。
在以下代码中,x 和 y 数据系列之间的四种不同关系绘制在两行两列的网格中。
from bokeh.plotting import figure, output_file, show
from bokeh.layouts import gridplot
import math
x = list(range(1,11))

y1 = x
y2 =[11-i for i in x]
y3 = [i*i for i in x]
y4 = [math.log10(i) for i in x]

fig1 = figure(plot_width = 200, plot_height = 200)
fig1.line(x, y1,line_width = 2, line_color = 'blue')
fig2 = figure(plot_width = 200, plot_height = 200)
fig2.circle(x, y2,size = 10, color = 'green')
fig3 = figure(plot_width = 200, plot_height = 200)
fig3.circle(x,y3, size = 10, color = 'grey')
fig4 = figure(plot_width = 200, plot_height = 200, y_axis_type = 'log')
fig4.line(x,y4, line_width = 2, line_color = 'red')
grid = gridplot(children = [[fig1, fig2], [fig3,fig4]], sizing_mode = 'stretch_both')
show(grid)
输出
