- Bokeh教程
- Bokeh - 主页
- Bokeh - 简介
- Bokeh - 环境设置
- Bokeh - 入门
- Bokeh - Jupyter Notebook
- Bokeh - 基本概念
- Bokeh - 带字形的图
- Bokeh - 面积图
- Bokeh - 圆形字形
- Bokeh - 矩形、椭圆形和多边形
- Bokeh - 楔形和弧形
- Bokeh - 专业曲线
- Bokeh - 设置范围
- Bokeh - 轴
- Bokeh - 注释和图例
- Bokeh - pandas
- Bokeh - ColumnDataSource
- Bokeh - 过滤数据
- Bokeh - 布局
- Bokeh - 绘图工具
- Bokeh - 视觉属性样式
- Bokeh - 自定义图例
- Bokeh - 添加小部件
- Bokeh - 服务器
- Bokeh - 使用 Bokeh 子命令
- Bokeh - 导出图
- Bokeh - 嵌入图和应用程序
- Bokeh - 扩展Bokeh
- Bokeh - WebGL
- Bokeh - 使用 JavaScript 进行开发
- Bokeh有用资源
- Bokeh - 快速指南
- Bokeh - 有用的资源
- Bokeh - 讨论
Bokeh - 快速指南
Bokeh - 简介
Bokeh 是一个 Python 数据可视化库。与 Matplotlib 和 Seaborn 不同,它们也是用于数据可视化的 Python 包,Bokeh 使用 HTML 和 JavaScript 渲染其绘图。因此,事实证明它对于开发基于 Web 的仪表板非常有用。
Bokeh 项目由 NumFocus https://numfocus.org/ 赞助。NumFocus 还支持 PyData,这是一个教育项目,参与 NumPy、Pandas 等其他重要工具的开发。Bokeh 可以轻松地与这些工具连接并生成交互式绘图、仪表板和数据应用程序。
特征
Bokeh 主要将数据源转换为 JSON 文件,该文件用作 BokehJS(一个 JavaScript 库)的输入,而 BokehJS 又是用 TypeScript 编写的,并在现代浏览器中呈现可视化效果。
Bokeh 的一些重要特征如下 -
灵活性
Bokeh 对于常见的绘图要求以及自定义和复杂的用例非常有用。
生产率
Bokeh 可以轻松地与其他流行的 Pydata 工具(例如 Pandas 和 Jupyter Notebook)进行交互。
互动性
这是 Bokeh 相对于 Matplotlib 和 Seaborn 的一个重要优势,两者都生成静态图。Bokeh 创建的交互式绘图在用户与其交互时会发生变化。您可以为受众提供广泛的选项和工具,用于从不同角度推断和查看数据,以便用户可以执行“假设”分析。
强大的
通过添加自定义 JavaScript,可以为专门的用例生成可视化效果。
可分享
绘图可以嵌入到支持Flask或Django的 Web 应用程序的输出中。它们也可以呈现在
朱皮特
笔记本。开源
Bokeh 是一个开源项目。它根据 Berkeley Source Distribution (BSD) 许可证进行分发。其源代码可在https://github.com/bokeh/bokeh 上获取。
Bokeh - 环境设置
Bokeh 只能安装在CPython版本2.7和3.5+上,无论是标准发行版还是 Anaconda 发行版。在撰写本教程时,Bokeh 的当前版本是 ver. 1.3.4. Bokeh 包具有以下依赖项 -
- 金贾2 >= 2.7
- numpy >= 1.7.1
- 包装 >= 16.8
- Pillow >= 4.0
- python-dateutil >= 2.1
- pyyaml >= 3.10
- 六 >= 1.5.2
- 龙卷风 >= 4.3
一般来说,使用 Python 内置的包管理器 PIP 安装 Bokeh 时会自动安装上述包,如下所示 -
pip3 install bokeh
如果您使用 Anaconda 发行版,请使用 conda 包管理器,如下所示 -
conda install bokeh
除了上述依赖项之外,出于特定目的,您可能还需要其他软件包,例如 pandas、psutil 等。
要验证 Bokeh 是否已成功安装,请在 Python 终端中导入 bokeh 包并检查其版本 -
>>> import bokeh
>>> bokeh.__version__
'1.3.4'
Bokeh - 入门
在两个 numpy 数组之间创建简单的线图非常简单。首先,从bokeh.plotting模块导入以下函数 -
from bokeh.plotting import figure, output_file, show
figure ()函数创建一个新的绘图图形。
output_file ()函数用于指定一个 HTML 文件来存储输出。
show ()函数在笔记本的浏览器中显示Bokeh图。
接下来,设置两个 numpy 数组,其中第二个数组是第一个数组的正弦值。
import numpy as np
import math
x = np.arange(0, math.pi*2, 0.05)
y = np.sin(x)
要获取 Bokeh Figure 对象,请指定标题以及 x 和 y 轴标签,如下所示 -
p = figure(title = "sine wave example", x_axis_label = 'x', y_axis_label = 'y')
Figure 对象包含一个 line() 方法,该方法向图形添加线字形。它需要 x 轴和 y 轴的数据系列。
p.line(x, y, legend = "sine", line_width = 2)
最后,设置输出文件并调用 show() 函数。
output_file("sine.html")
show(p)
这将在“sine.html”中呈现线图,并将显示在浏览器中。
完整代码及其输出如下
from bokeh.plotting import figure, output_file, show
import numpy as np
import math
x = np.arange(0, math.pi*2, 0.05)
y = np.sin(x)
output_file("sine.html")
p = figure(title = "sine wave example", x_axis_label = 'x', y_axis_label = 'y')
p.line(x, y, legend = "sine", line_width = 2)
show(p)
浏览器上的输出

Bokeh - Jupyter Notebook
在 Jupyter Notebook 中显示 Bokeh 图与上面的非常相似。您需要做的唯一更改是从 bokeh.plotting 模块导入output_notebook 而不是output_file。
from bokeh.plotting import figure, output_notebook, show
调用output_notebook()函数将Jupyter笔记本的输出单元设置为show()函数的目标,如下所示 -
output_notebook()
show(p)
在笔记本单元格中输入代码并运行它。正弦波将显示在笔记本内部。
Bokeh - 基本概念
Bokeh 包提供了两个接口,可以使用它们执行各种绘图操作。
Bokeh模型
该模块是一个低级接口。它为应用程序开发人员开发可视化提供了极大的灵活性。Bokeh 图生成一个包含 BokehJS 库使用的场景的视觉和数据方面的对象。组成 Bokeh 场景图的低级对象称为模型。
Bokeh绘图
这是一个更高级别的界面,具有组成视觉字形的功能。该模块包含Figure 类的定义。它实际上是 bokeh.models 模块中定义的绘图类的子类。
图类简化了绘图创建。它包含绘制不同矢量化图形符号的各种方法。字形是Bokeh图的构建块,例如直线、圆形、矩形和其他形状。
Bokeh应用程序
Bokeh 包 Application 类是用于创建 Bokeh 文档的轻量级工厂。文档是 Bokeh 模型的容器,可反映到客户端 BokehJS 库。
Bokeh服务器
它提供可定制的 Bokeh Server Tornadocore 应用程序。服务器用于向您选择的受众共享和发布交互式Plotly和应用程序。
Bokeh - 带字形的图
任何绘图通常由一个或多个几何形状组成,例如直线、圆形、矩形等。这些形状具有有关相应数据集的视觉信息。在 Bokeh 术语中,这些几何形状称为 gylph。使用bokeh.plotting 接口构建的 Bokeh 图使用一组默认的工具和样式。但是,可以使用可用的绘图工具自定义样式。
地块类型
使用字形创建的不同类型的绘图如下所示 -
线图
这种类型的图对于以线的形式可视化点沿 x 轴和 y 轴的移动非常有用。它用于执行时间序列分析。
条形图
这通常可用于指示数据集中特定列或字段的每个类别的计数。
斑块图
该图表示具有特定颜色阴影的点区域。这种类型的图用于区分同一数据集中的不同组。
散点图
此类图用于可视化两个变量之间的关系并指示它们之间的相关强度。
通过调用Figure类的适当方法形成不同的字形图。Figure 对象是通过以下构造函数获得的 -
from bokeh.plotting import figure
figure(**kwargs)
Figure 对象可以通过各种关键字参数进行自定义。
| 先生编号 | 标题 | 设置图的标题 |
|---|---|---|
| 1 | x_轴_标签 | 设置x轴标题 |
| 2 | y 轴标签 | 设置 y 轴标题 |
| 3 | 绘图宽度 | 设置图形宽度 |
| 4 | 绘图高度 | 设置图形高度 |
线图
Figure 对象的line () 方法向 Bokeh 图形添加线条字形。它需要 x 和 y 参数作为数据数组来显示它们的线性关系。
from bokeh.plotting import figure, show
fig = figure()
fig.line(x,y)
show(fig)
以下代码以 Python 列表对象的形式呈现两组值之间的简单线图 -
from bokeh.plotting import figure, output_file, show
x = [1,2,3,4,5]
y = [2,4,6,8,10]
output_file('line.html')
fig = figure(title = 'Line Plot example', x_axis_label = 'x', y_axis_label = 'y')
fig.line(x,y)
show(fig)
输出

条形图
图对象有两种不同的方法来构建条形图
哈巴()
条形在绘图宽度上水平显示。hbar () 方法具有以下参数 -
| 先生编号 | y | 水平条中心的 y 坐标。 |
|---|---|---|
| 1 | 高度 | 垂直条的高度。 |
| 2 | 正确的 | 右边缘的 x 坐标。 |
| 3 | 左边 | 左边缘的 x 坐标。 |
以下代码是使用 Bokeh 的水平条的示例。
from bokeh.plotting import figure, output_file, show
fig = figure(plot_width = 400, plot_height = 200)
fig.hbar(y = [2,4,6], height = 1, left = 0, right = [1,2,3], color = "Cyan")
output_file('bar.html')
show(fig)
输出

vbar()
条形图垂直显示在绘图高度上。vbar () 方法具有以下参数 -
| 先生编号 | X | 垂直条中心的 x 坐标。 |
|---|---|---|
| 1 | 宽度 | 垂直条的宽度。 |
| 2 | 顶部 | 顶部边缘的 y 坐标。 |
| 3 | 底部 | 底部边缘的 y 坐标。 |
以下代码显示垂直条形图-
from bokeh.plotting import figure, output_file, show
fig = figure(plot_width = 200, plot_height = 400)
fig.vbar(x = [1,2,3], width = 0.5, bottom = 0, top = [2,4,6], color = "Cyan")
output_file('bar.html')
show(fig)
输出

斑块图
用特定颜色对空间区域进行阴影以显示具有相似属性的区域或组的图在 Bokeh 中称为斑块图。为此,Figure 对象有 patch() 和 patch() 方法。
修补()
此方法将补丁字形添加到给定的图形中。该方法有以下参数 -
| 1 | X | 面片点的 x 坐标。 |
| 2 | y | 面片点的 y 坐标。 |
通过以下 Python 代码可以获得一个简单的补丁图-
from bokeh.plotting import figure, output_file, show
p = figure(plot_width = 300, plot_height = 300)
p.patch(x = [1, 3,2,4], y = [2,3,5,7], color = "green")
output_file('patch.html')
show(p)
输出

补丁()
该方法用于绘制多个多边形面片。它需要以下参数 -
| 1 | xs | 所有补丁的 x 坐标,以“列表的列表”形式给出。 |
| 2 | 是 | 所有补丁的 y 坐标,以“列表的列表”形式给出。 |
作为 patch() 方法的示例,运行以下代码 -
from bokeh.plotting import figure, output_file, show
xs = [[5,3,4], [2,4,3], [2,3,5,4]]
ys = [[6,4,2], [3,6,7], [2,4,7,8]]
fig = figure()
fig.patches(xs, ys, fill_color = ['red', 'blue', 'black'], line_color = 'white')
output_file('patch_plot.html')
show(fig)
输出

分散标记
散点图非常常用于确定两个变量之间的双变量关系。使用 Bokeh 增强了交互性。散点图是通过调用Figure对象的scatter()方法获得的。它使用以下参数 -
| 1 | X | 中心 x 坐标的值或字段名称 |
| 2 | y | 中心 y 坐标的值或字段名称 |
| 3 | 尺寸 | 以屏幕单位表示的尺寸值或字段名称 |
| 4 | 标记 | 标记类型的值或字段名称 |
| 5 | 颜色 | 设置填充和线条颜色 |
Bokeh 中定义了以下标记类型常量: -
- 星号
- 圆圈
- 圆十字
- 圆X
- 叉
- 短跑
- 钻石
- 钻石十字
- 十六进制
- 倒三角
- 正方形
- 方形十字
- 方X
- 三角形
- X
以下 Python 代码生成带有圆圈标记的散点图。
from bokeh.plotting import figure, output_file, show
fig = figure()
fig.scatter([1, 4, 3, 2, 5], [6, 5, 2, 4, 7], marker = "circle", size = 20, fill_color = "grey")
output_file('scatter.html')
show(fig)
输出

Bokeh - 面积图
面积图是共享共同索引的两个系列之间的填充区域。Bokeh 的 Figure 类有两种方法,如下所示 -
瓦雷亚()
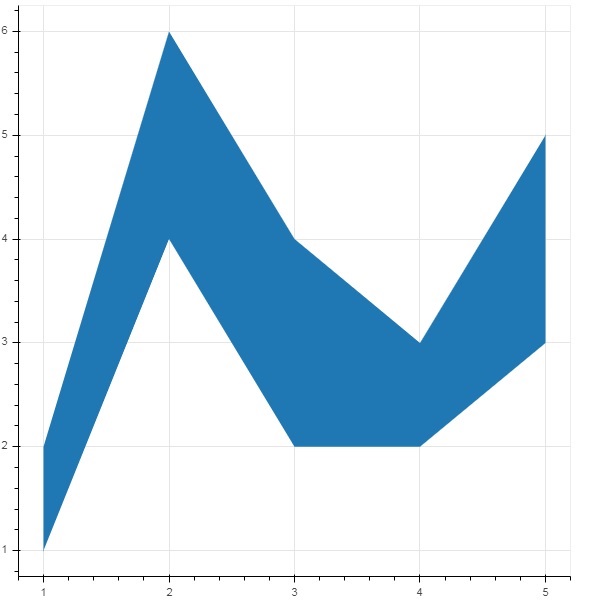
varea() 方法的输出是一个垂直有向区域,具有一个 x 坐标数组和两个 y 坐标数组 y1 和 y2,这两个数组将在其间填充。
| 1 | X | 区域点的 x 坐标。 |
| 2 | y1 | 区域一侧的点的 y 坐标。 |
| 3 | y2 | 区域另一侧的点的 y 坐标。 |
例子
from bokeh.plotting import figure, output_file, show
fig = figure()
x = [1, 2, 3, 4, 5]
y1 = [2, 6, 4, 3, 5]
y2 = [1, 4, 2, 2, 3]
fig.varea(x = x,y1 = y1,y2 = y2)
output_file('area.html')
show(fig)
输出
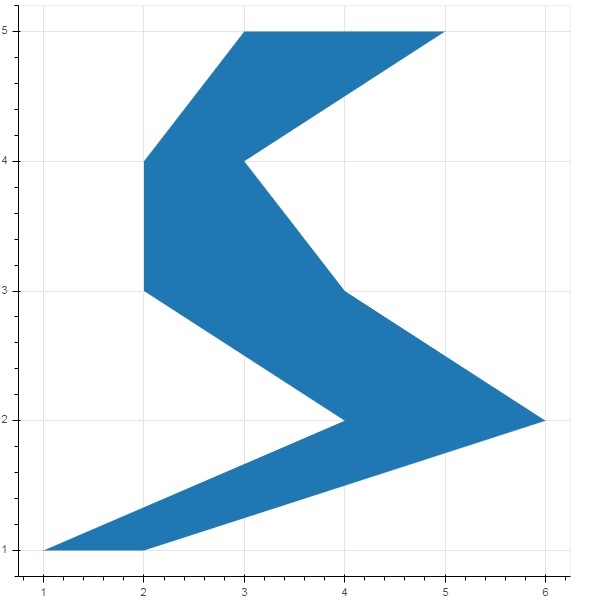
哈雷亚()
另一方面,harea() 方法需要 x1、x2 和 y 参数。
| 1 | x1 | 区域一侧的点的 x 坐标。 |
| 2 | x2 | 区域另一侧的点的 x 坐标。 |
| 3 | y | 区域点的 y 坐标。 |
例子
from bokeh.plotting import figure, output_file, show
fig = figure()
y = [1, 2, 3, 4, 5]
x1 = [2, 6, 4, 3, 5]
x2 = [1, 4, 2, 2, 3]
fig.harea(x1 = x1,x2 = x2,y = y)
output_file('area.html')
show(fig)
输出
Bokeh - 圆形字形
图形对象有许多方法,可以使用这些方法绘制不同形状的矢量化字形,例如圆形、矩形、多边形等。
以下方法可用于绘制圆形字形-
圆圈()
Circle ()方法向图形添加一个圆形字形,并需要其中心的x 和y坐标。此外,还可以借助fill_color、line-color、line_width等参数进行配置。
圆交叉()
Circle_cross() 方法添加带有穿过中心的“+”十字的圆形字形。
圆_x()
Circle_x() 方法添加一个带有穿过中心的“X”十字的圆。
例子
以下示例显示了添加到Bokeh图中的各种圆形字形的使用 -
from bokeh.plotting import figure, output_file, show
plot = figure(plot_width = 300, plot_height = 300)
plot.circle(x = [1, 2, 3], y = [3,7,5], size = 20, fill_color = 'red')
plot.circle_cross(x = [2,4,6], y = [5,8,9], size = 20, fill_color = 'blue',fill_alpha = 0.2, line_width = 2)
plot.circle_x(x = [5,7,2], y = [2,4,9], size = 20, fill_color = 'green',fill_alpha = 0.6, line_width = 2)
show(plot)
输出

Bokeh - 矩形、椭圆形和多边形
可以在Bokeh图中渲染矩形、椭圆形和多边形。Figure 类的rect () 方法根据中心、宽度和高度的 x 和 y 坐标添加矩形字形。另一方面,square() 方法有 size 参数来决定尺寸。
ellipse() 和 oval() 方法添加椭圆和卵形字形。它们使用与具有 x、y、w 和 h 参数的 rect() 类似的签名。此外,角度参数确定相对于水平方向的旋转。
例子
以下代码显示了不同形状字形方法的使用-
from bokeh.plotting import figure, output_file, show
fig = figure(plot_width = 300, plot_height = 300)
fig.rect(x = 10,y = 10,width = 100, height = 50, width_units = 'screen', height_units = 'screen')
fig.square(x = 2,y = 3,size = 80, color = 'red')
fig.ellipse(x = 7,y = 6, width = 30, height = 10, fill_color = None, line_width = 2)
fig.oval(x = 6,y = 6,width = 2, height = 1, angle = -0.4)
show(fig)
输出

Bokeh - 楔形和弧形
arc () 方法根据 x 和 y 坐标、起始角度和结束角度以及半径绘制简单的线弧。角度以弧度表示,而半径可以以屏幕单位或数据单位表示。楔形是实心圆弧。
wedge () 方法与 arc() 方法具有相同的属性。两种方法都提供可选的方向属性,可以是时钟或反时钟,确定弧/楔形渲染的方向。numeric_wedge() 函数渲染内半径和外半径的弧之间的填充区域。
例子
以下是添加到Bokeh图中的弧形和楔形字形的示例-
from bokeh.plotting import figure, output_file, show
import math
fig = figure(plot_width = 300, plot_height = 300)
fig.arc(x = 3, y = 3, radius = 50, radius_units = 'screen', start_angle = 0.0, end_angle = math.pi/2)
fig.wedge(x = 3, y = 3, radius = 30, radius_units = 'screen',
start_angle = 0, end_angle = math.pi, direction = 'clock')
fig.annular_wedge(x = 3,y = 3, inner_radius = 100, outer_radius = 75,outer_radius_units = 'screen',
inner_radius_units = 'screen',start_angle = 0.4, end_angle = 4.5,color = "green", alpha = 0.6)
show(fig)
输出

Bokeh - 专业曲线
bokeh.plotting API 支持按照特殊曲线进行渲染的方法-
贝泽尔()
此方法将贝塞尔曲线添加到图形对象。贝塞尔曲线是计算机图形学中使用的参数曲线。其他用途包括计算机字体和动画的设计、用户界面设计以及平滑光标轨迹。
在矢量图形中,贝塞尔曲线用于建模可以无限缩放的平滑曲线。“路径”是链接的贝塞尔曲线的组合。
beizer() 方法具有以下定义的参数 -
| 1 | x0 | 起点的 x 坐标。 |
| 2 | y0 | 起点的 y 坐标.. |
| 3 | x1 | 终点的 x 坐标。 |
| 4 | y1 | 终点的 y 坐标。 |
| 5 | CX0 | 第一个控制点的 x 坐标。 |
| 6 | 赛0 | 第一个控制点的 y 坐标。 |
| 7 | CX1 | 第二个控制点的 x 坐标。 |
| 8 | 细胞周期1 | 第二个控制点的 y 坐标。 |
所有参数的默认值为 None。
例子
以下代码生成一个 HTML 页面,在Bokeh图中显示贝塞尔曲线和抛物线 -
x = 2
y = 4
xp02 = x+0.4
xp01 = x+0.1
xm01 = x-0.1
yp01 = y+0.2
ym01 = y-0.2
fig = figure(plot_width = 300, plot_height = 300)
fig.bezier(x0 = x, y0 = y, x1 = xp02, y1 = y, cx0 = xp01, cy0 = yp01,
cx1 = xm01, cy1 = ym01, line_color = "red", line_width = 2)
输出

二次()
此方法向Bokeh图添加抛物线字形。该函数具有与 beizer() 相同的参数,但cx0和cx1除外。
例子
下面给出的代码生成一条二次曲线。
x = 2
y = 4
xp02 = x + 0.3
xp01 = x + 0.2
xm01 = x - 0.4
yp01 = y + 0.1
ym01 = y - 0.2
x = x,
y = y,
xp02 = x + 0.4,
xp01 = x + 0.1,
yp01 = y + 0.2,
fig.quadratic(x0 = x, y0 = y, x1 = x + 0.4, y1 = y + 0.01, cx = x + 0.1,
cy = y + 0.2, line_color = "blue", line_width = 3)
输出

Bokeh - 设置范围
Bokeh 会根据正在处理的数据集自动设置绘图数据轴的数值范围。但是,有时您可能想要显式定义 x 轴和 y 轴上的值范围。这是通过将 x_range 和 y_range 属性分配给figure() 函数来完成的。
这些范围是在 range1d() 函数的帮助下定义的。
例子
xrange = range1d(0,10)
要使用此范围对象作为 x_range 属性,请使用以下代码 -
fig = figure(x,y,x_range = xrange)
Bokeh - 轴
在本章中,我们将讨论各种类型的轴。
| 先生编号 | 轴 | 描述 |
|---|---|---|
| 1 | 分类轴 | Bokeh图显示沿 x 轴和 y 轴的数值数据。为了沿任一轴使用分类数据,我们需要指定 FactorRange 来指定其中一个轴的分类维度。 |
| 2 | 对数刻度轴 | 如果 x 和 y 数据系列之间存在幂律关系,则最好在两个轴上使用对数刻度。 |
| 3 | 双轴 | 可能需要在单个绘图上显示代表不同范围的多个轴。可以通过定义extra_x_range和extra_y_range属性来配置图形对象 |
分类轴
在目前的示例中,Bokeh图显示了沿 x 轴和 y 轴的数值数据。为了沿任一轴使用分类数据,我们需要指定 FactorRange 来指定其中一个轴的分类维度。例如,使用给定列表中的字符串作为 x 轴 -
langs = ['C', 'C++', 'Java', 'Python', 'PHP']
fig = figure(x_range = langs, plot_width = 300, plot_height = 300)
例子
在下面的示例中,显示了一个简单的条形图,显示了注册提供的各种课程的学生人数。
from bokeh.plotting import figure, output_file, show
langs = ['C', 'C++', 'Java', 'Python', 'PHP']
students = [23,17,35,29,12]
fig = figure(x_range = langs, plot_width = 300, plot_height = 300)
fig.vbar(x = langs, top = students, width = 0.5)
show(fig)
输出

要以不同的颜色显示每个条形,请将 vbar() 函数的颜色属性设置为颜色值列表。
cols = ['red','green','orange','navy', 'cyan']
fig.vbar(x = langs, top = students, color = cols,width=0.5)
输出

要使用 vbar_stack() 或 hbar_stack() 函数渲染垂直(或水平)堆叠条,请将 stackers 属性设置为要连续堆叠的字段列表,并将 source 属性设置为包含与每个字段对应的值的 dict 对象。
在下面的示例中,sales 是一个字典,显示三个月内三种产品的销售数据。
from bokeh.plotting import figure, output_file, show
products = ['computer','mobile','printer']
months = ['Jan','Feb','Mar']
sales = {'products':products,
   'Jan':[10,40,5],
   'Feb':[8,45,10],
   'Mar':[25,60,22]}
cols = ['red','green','blue']#,'navy', 'cyan']
fig = figure(x_range = products, plot_width = 300, plot_height = 300)
fig.vbar_stack(months, x = 'products', source = sales, color = cols,width = 0.5)
show(fig)
输出

分组条形图是通过在bokeh.transform模块中的 dodge() 函数的帮助下指定条形的视觉位移来获得的。
dodge () 函数为每个条形图引入相对偏移,从而实现组的视觉印象。在以下示例中,vbar() 字形对于特定月份的每组条形图以 0.25 的偏移量分隔。
from bokeh.plotting import figure, output_file, show
from bokeh.transform import dodge
products = ['computer','mobile','printer']
months = ['Jan','Feb','Mar']
sales = {'products':products,
   'Jan':[10,40,5],
   'Feb':[8,45,10],
   'Mar':[25,60,22]}
fig = figure(x_range = products, plot_width = 300, plot_height = 300)
fig.vbar(x = dodge('products', -0.25, range = fig.x_range), top = 'Jan',
   width = 0.2,source = sales, color = "red")
fig.vbar(x = dodge('products', 0.0, range = fig.x_range), top = 'Feb',
   width = 0.2, source = sales,color = "green")
fig.vbar(x = dodge('products', 0.25, range = fig.x_range), top = 'Mar',
   width = 0.2,source = sales,color = "blue")
show(fig)
输出

对数刻度轴
当图的一个轴上的值随着另一个轴上的值呈指数增长而另一个轴上的值线性增加时,通常需要将前一个轴上的数据以对数刻度显示。例如,如果 x 和 y 数据系列之间存在幂律关系,则最好在两个轴上使用对数刻度。
Bokeh.plotting API 的figure() 函数接受 x_axis_type 和 y_axis_type 作为参数,可以通过传递“log”作为这些参数之一的值来将其指定为对数轴。
第一张图显示了 x 和 10x 之间的线性标度图。在第二张图中,y_axis_type 设置为“log”
from bokeh.plotting import figure, output_file, show
x = [0.1, 0.5, 1.0, 1.5, 2.0, 2.5, 3.0]
y = [10**i for i in x]
fig = figure(title = 'Linear scale example',plot_width = 400, plot_height = 400)
fig.line(x, y, line_width = 2)
show(fig)
输出

现在更改figure()函数来配置y_axis_type='log'
fig = figure(title = 'Linear scale example',plot_width = 400, plot_height = 400, y_axis_type = "log")
输出

双轴
在某些情况下,可能需要在单个绘图上显示表示不同范围的多个轴。可以通过定义extra_x_range和extra_y_range属性来配置图形对象。在向图形添加新字形时,将使用这些命名范围。
我们尝试在同一图中显示正弦曲线和直线。两个字形都有不同范围的 y 轴。正弦曲线和直线的 x 和 y 数据系列通过以下方式获得 -
from numpy import pi, arange, sin, linspace
x = arange(-2*pi, 2*pi, 0.1)
y = sin(x)
y2 = linspace(0, 100, len(y))
这里,x 和 y 之间的图表示正弦关系,x 和 y2 之间的图是直线。Figure 对象使用显式 y_range 进行定义,并添加表示正弦曲线的线字形,如下所示 -
fig = figure(title = 'Twin Axis Example', y_range = (-1.1, 1.1))
fig.line(x, y, color = "red")
我们需要一个额外的 y 范围。它定义为 -
fig.extra_y_ranges = {"y2": Range1d(start = 0, end = 100)}
要在右侧添加额外的 y 轴,请使用 add_layout() 方法。将代表 x 和 y2 的新线字形添加到图中。
fig.add_layout(LinearAxis(y_range_name = "y2"), 'right')
fig.line(x, y2, color = "blue", y_range_name = "y2")
这将产生具有双 y 轴的图。完整代码和输出如下 -
from numpy import pi, arange, sin, linspace
x = arange(-2*pi, 2*pi, 0.1)
y = sin(x)
y2 = linspace(0, 100, len(y))
from bokeh.plotting import output_file, figure, show
from bokeh.models import LinearAxis, Range1d
fig = figure(title='Twin Axis Example', y_range = (-1.1, 1.1))
fig.line(x, y, color = "red")
fig.extra_y_ranges = {"y2": Range1d(start = 0, end = 100)}
fig.add_layout(LinearAxis(y_range_name = "y2"), 'right')
fig.line(x, y2, color = "blue", y_range_name = "y2")
show(fig)
输出

Bokeh - 注释和图例
注释是添加到图表中的解释性文本片段。Bokeh图可以通过指定绘图标题、x 轴和 y 轴标签以及在绘图区域中的任何位置插入文本标签来注释。
绘图标题以及 x 和 y 轴标签可以在图构造函数本身中提供。
fig = figure(title, x_axis_label, y_axis_label)
在下图中,这些属性设置如下 -
from bokeh.plotting import figure, output_file, show
import numpy as np
import math
x = np.arange(0, math.pi*2, 0.05)
y = np.sin(x)
fig = figure(title = "sine wave example", x_axis_label = 'angle', y_axis_label = 'sin')
fig.line(x, y,line_width = 2)
show(p)
输出

标题的文本和轴标签也可以通过将适当的字符串值分配给图形对象的相应属性来指定。
fig.title.text = "sine wave example"
fig.xaxis.axis_label = 'angle'
fig.yaxis.axis_label = 'sin'
还可以指定标题的位置、对齐方式、字体和颜色。
fig.title.align = "right"
fig.title.text_color = "orange"
fig.title.text_font_size = "25px"
fig.title.background_fill_color = "blue"
向绘图添加图例非常容易。我们必须使用任何字形方法的图例属性。
下面我们在图中有三个字形曲线,具有三个不同的图例 -
from bokeh.plotting import figure, output_file, show
import numpy as np
import math
x = np.arange(0, math.pi*2, 0.05)
fig = figure()
fig.line(x, np.sin(x),line_width = 2, line_color = 'navy', legend = 'sine')
fig.circle(x,np.cos(x), line_width = 2, line_color = 'orange', legend = 'cosine')
fig.square(x,-np.sin(x),line_width = 2, line_color = 'grey', legend = '-sine')
show(fig)
输出

Bokeh - pandas
在上面的所有示例中,要绘制的数据均以 Python 列表或 numpy 数组的形式提供。还可以以 pandas DataFrame 对象的形式提供数据源。
DataFrame是一种二维数据结构。数据框中的列可以具有不同的数据类型。Pandas 库具有从各种来源(例如 CSV 文件、Excel 工作表、SQL 表等)创建数据框的功能。
出于以下示例的目的,我们使用由两列组成的 CSV 文件,分别代表数字 x 和 10x。test.csv 文件如下 -
x,pow
0.0,1.0
0.5263157894736842,3.3598182862837818
1.0526315789473684,11.28837891684689
1.5789473684210527,37.926901907322495
2.1052631578947367,127.42749857031335
2.631578947368421,428.1332398719391
3.1578947368421053,1438.449888287663
3.6842105263157894,4832.930238571752
4.2105263157894735,16237.76739188721
4.7368421052631575,54555.947811685146
我们将使用 pandas 中的 read_csv() 函数在数据帧对象中读取此文件。
import pandas as pd
df = pd.read_csv('test.csv')
print (df)
数据框如下所示 -
x        pow
0 0.000000 1.000000
1 0.526316 3.359818
2 1.052632 11.288379
3 1.578947 37.926902
4 2.105263 127.427499
5 2.631579 428.133240
6 3.157895 1438.449888
7 3.684211 4832.930239
8 4.210526 16237.767392
9 4.736842 54555.947812
“x”和“pow”列用作Bokeh图中线字形的数据系列。
from bokeh.plotting import figure, output_file, show
p = figure()
x = df['x']
y = df['pow']
p.line(x,y,line_width = 2)
p.circle(x, y,size = 20)
show(p)
输出

Bokeh - ColumnDataSource
Bokeh API 中的大多数绘图方法都能够通过 ColumnDatasource 对象接收数据源参数。它可以在绘图和“数据表”之间共享数据。
ColumnDatasource 可以被视为列名和数据列表之间的映射。具有一个或多个字符串键和列表或 numpy 数组作为值的 Python 字典对象将传递给 ColumnDataSource 构造函数。
例子
下面是例子
from bokeh.models import ColumnDataSource
data = {'x':[1, 4, 3, 2, 5],
   'y':[6, 5, 2, 4, 7]}
cds = ColumnDataSource(data = data)
然后,该对象在字形方法中用作源属性的值。以下代码使用 ColumnDataSource 生成散点图。
from bokeh.plotting import figure, output_file, show
from bokeh.models import ColumnDataSource
data = {'x':[1, 4, 3, 2, 5],
   'y':[6, 5, 2, 4, 7]}
cds = ColumnDataSource(data = data)
fig = figure()
fig.scatter(x = 'x', y = 'y',source = cds, marker = "circle", size = 20, fill_color = "grey")
show(fig)
输出

我们可以使用 Pandas DataFrame,而不是将 Python 字典分配给 ColumnDataSource。
让我们使用“test.csv”(本节前面使用的)来获取 DataFrame 并使用它来获取 ColumnDataSource 和渲染线图。
from bokeh.plotting import figure, output_file, show
import pandas as pd
from bokeh.models import ColumnDataSource
df = pd.read_csv('test.csv')
cds = ColumnDataSource(df)
fig = figure(y_axis_type = 'log')
fig.line(x = 'x', y = 'pow',source = cds, line_color = "grey")
show(fig)
输出

Bokeh - 过滤数据
通常,您可能希望获得与满足某些条件的部分数据而不是整个数据集相关的图。bokeh.models 模块中定义的 CDSView 类的对象通过在其上应用一个或多个过滤器来返回正在考虑的 ColumnDatasource 的子集。
IndexFilter 是最简单的过滤器类型。您必须仅指定在绘制图形时要使用的数据集中那些行的索引。
以下示例演示了如何使用 IndexFilter 来设置 CDSView。结果图显示了 ColumnDataSource 的 x 和 y 数据系列之间的线字形。通过对视图对象应用索引过滤器来获取视图对象。该视图用于绘制作为 IndexFilter 的结果的圆形字形。
例子
from bokeh.models import ColumnDataSource, CDSView, IndexFilter
from bokeh.plotting import figure, output_file, show
source = ColumnDataSource(data = dict(x = list(range(1,11)), y = list(range(2,22,2))))
view = CDSView(source=source, filters = [IndexFilter([0, 2, 4,6])])
fig = figure(title = 'Line Plot example', x_axis_label = 'x', y_axis_label = 'y')
fig.circle(x = "x", y = "y", size = 10, source = source, view = view, legend = 'filtered')
fig.line(source.data['x'],source.data['y'], legend = 'unfiltered')
show(fig)
输出

要仅从数据源中选择满足特定布尔条件的行,请应用 BooleanFilter。
典型的 Bokeh 安装由 Sampledata 目录中的许多示例数据集组成。对于以下示例,我们使用以union1948.csv 形式提供的union1948数据集。它存储自 1948 年以来美国逐年的失业率百分比。我们只想生成 1980 年以后的绘图。为此,通过对给定数据源应用 BooleanFilter 来获取 CDSView 对象。
from bokeh.models import ColumnDataSource, CDSView, BooleanFilter
from bokeh.plotting import figure, show
from bokeh.sampledata.unemployment1948 import data
source = ColumnDataSource(data)
booleans = [True if int(year) >= 1980 else False for year in
source.data['Year']]
print (booleans)
view1 = CDSView(source = source, filters=[BooleanFilter(booleans)])
p = figure(title = "Unemployment data", x_range = (1980,2020), x_axis_label = 'Year', y_axis_label='Percentage')
p.line(x = 'Year', y = 'Annual', source = source, view = view1, color = 'red', line_width = 2)
show(p)
输出

为了增加应用过滤器的灵活性,Bokeh 提供了 CustomJSFilter 类,借助该类可以使用用户定义的 JavaScript 函数来过滤数据源。
下面给出的示例使用相同的美国失业数据。定义 CustomJSFilter 来绘制 1980 年及之后的失业数据。
from bokeh.models import ColumnDataSource, CDSView, CustomJSFilter
from bokeh.plotting import figure, show
from bokeh.sampledata.unemployment1948 import data
source = ColumnDataSource(data)
custom_filter = CustomJSFilter(code = '''
   var indices = [];

   for (var i = 0; i < source.get_length(); i++){
      if (parseInt(source.data['Year'][i]) > = 1980){
         indices.push(true);
      } else {
         indices.push(false);
      }
   }
   return indices;
''')
view1 = CDSView(source = source, filters = [custom_filter])
p = figure(title = "Unemployment data", x_range = (1980,2020), x_axis_label = 'Year', y_axis_label = 'Percentage')
p.line(x = 'Year', y = 'Annual', source = source, view = view1, color = 'red', line_width = 2)
show(p)
Bokeh - 布局
Bokeh可视化可以适当地安排在不同的布局选项中。这些布局以及大小调整模式会导致绘图和小部件根据浏览器窗口的大小自动调整大小。为了保持外观一致,布局中的所有项目必须具有相同的大小调整模式。小部件(按钮、菜单等)保存在单独的小部件框中,而不是在图中。
第一种布局是列布局,它垂直显示绘图。column () 函数在bokeh.layouts模块中定义,并采用以下签名 -
from bokeh.layouts import column
col = column(children, sizing_mode)
Children - 绘图和/或小部件列表。
sizing_mode - 确定布局中的项目如何调整大小。可能的值为“fixed”、“stretch_both”、“scale_width”、“scale_height”、“scale_both”。默认为“固定”。
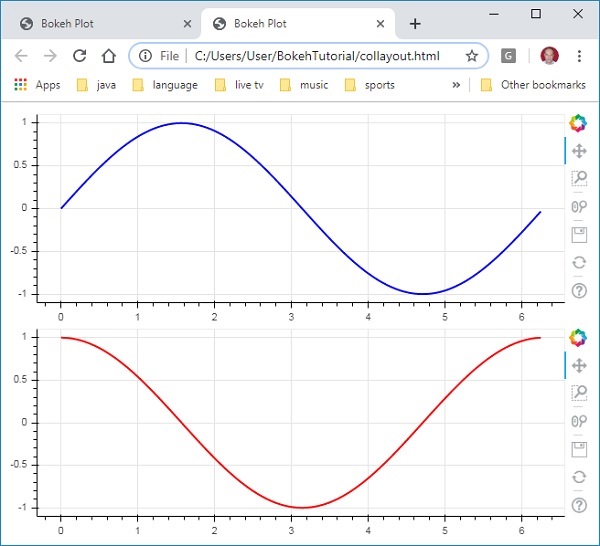
以下代码生成两个Bokeh图并将它们放置在列布局中,以便它们垂直显示。每个图中都显示了表示 x 和 y 数据系列之间的正弦和余弦关系的线字形。
from bokeh.plotting import figure, output_file, show
from bokeh.layouts import column
import numpy as np
import math
x = np.arange(0, math.pi*2, 0.05)
y1 = np.sin(x)
y2 = np.cos(x)
fig1 = figure(plot_width = 200, plot_height = 200)
fig1.line(x, y1,line_width = 2, line_color = 'blue')
fig2 = figure(plot_width = 200, plot_height = 200)
fig2.line(x, y2,line_width = 2, line_color = 'red')
c = column(children = [fig1, fig2], sizing_mode = 'stretch_both')
show(c)
输出
类似地,行布局水平排列绘图,使用 bokeh.layouts 模块中定义的row() 函数。正如您所想,它还需要两个参数(类似于column()函数)——children和sizing_mode。
上图中垂直显示的正弦和余弦曲线现在通过以下代码在行布局中水平显示
from bokeh.plotting import figure, output_file, show
from bokeh.layouts import row
import numpy as np
import math
x = np.arange(0, math.pi*2, 0.05)
y1 = np.sin(x)
y2 = np.cos(x)
fig1 = figure(plot_width = 200, plot_height = 200)
fig1.line(x, y1,line_width = 2, line_color = 'blue')
fig2 = figure(plot_width = 200, plot_height = 200)
fig2.line(x, y2,line_width = 2, line_color = 'red')
r = row(children = [fig1, fig2], sizing_mode = 'stretch_both')
show(r)
输出

Bokeh 包也有网格布局。它在行和列的二维网格中包含多个绘图图形(以及小部件)。bokeh.layouts 模块中的gridplot () 函数返回一个网格和一个统一的工具栏,可以借助 Toolbar_location 属性来定位该工具栏。
这与行或列布局不同,在行或列布局中,每个图都显示自己的工具栏。grid() 函数也使用children 和sizing_mode 参数,其中children 是列表的列表。确保每个子列表具有相同的尺寸。
在以下代码中,x 和 y 数据系列之间的四种不同关系绘制在两行两列的网格中。
from bokeh.plotting import figure, output_file, show
from bokeh.layouts import gridplot
import math
x = list(range(1,11))

y1 = x
y2 =[11-i for i in x]
y3 = [i*i for i in x]
y4 = [math.log10(i) for i in x]

fig1 = figure(plot_width = 200, plot_height = 200)
fig1.line(x, y1,line_width = 2, line_color = 'blue')
fig2 = figure(plot_width = 200, plot_height = 200)
fig2.circle(x, y2,size = 10, color = 'green')
fig3 = figure(plot_width = 200, plot_height = 200)
fig3.circle(x,y3, size = 10, color = 'grey')
fig4 = figure(plot_width = 200, plot_height = 200, y_axis_type = 'log')
fig4.line(x,y4, line_width = 2, line_color = 'red')
grid = gridplot(children = [[fig1, fig2], [fig3,fig4]], sizing_mode = 'stretch_both')
show(grid)
输出

Bokeh - 绘图工具
渲染Bokeh图时,通常会在图的右侧出现一个工具栏。它包含一组默认工具。首先,工具栏的位置可以通过figure()函数中的toolbar_location属性来配置。该属性可以采用以下值之一 -
- “多于”
- “以下”
- “左边”
- “正确的”
- “没有任何”
例如,以下语句将导致工具栏显示在图下方 -
Fig = figure(toolbar_location = "below")
该工具栏可以根据需要通过添加 bokeh.models 模块中定义的各种工具所需的内容来配置。例如 -
Fig.add_tools(WheelZoomTool())
这些工具可分为以下类别 -
- 平移/拖动工具
- 单击/点击工具
- 滚动/捏合工具
| 工具 | 描述 | 图标 |
|---|---|---|
框选工具 名称:'box_select' |
允许用户通过左键拖动鼠标来定义矩形选择区域 |  |
套索选择工具 名称:'套索选择 |
允许用户通过鼠标左键拖动来定义任意区域进行选择 |  |
平移工具 名称:'潘','xpan','ypan', |
允许用户通过左键拖动鼠标来平移绘图 |  |
点击工具 名称:'点击 |
允许用户通过单击鼠标左键来选择单个点 |  |
滚轮缩放工具 名称:'wheel_zoom'、'xwheel_zoom'、'ywheel_zoom' |
以当前鼠标位置为中心放大和缩小绘图。 |  |
轮盘工具 名称:“xwheel_pan”、“ywheel_pan” |
沿指定尺寸平移绘图窗口,而不更改窗口的纵横比。 |  |
重置工具 名称:“重置” |
将绘图范围恢复为其原始值。 |  |
保存工具 名称:“保存” |
允许用户保存绘图的 PNG 图像。 |  |
放大工具 名称:“zoom_in”、“xzoom_in”、“yzoom_in” |
放大工具将增加绘图在 x、y 或两个坐标上的缩放 |  |
缩小工具 名称:'zoom_out'、'xzoom_out'、'yzoom_out' |
缩小工具将减小 x、y 或两个坐标中绘图的缩放 |  |
十字准线工具 名称:“十字准线” |
在绘图上以当前鼠标位置为中心绘制十字准线注释。 |  |
Bokeh - 视觉属性样式
可以通过将各种属性设置为所需值来自定义Bokeh图的默认外观。这些属性主要分为三种类型 -
线路属性
下表列出了与线字形相关的各种属性。
| 1 | 线条颜色 | 颜色用于描边线条 |
| 2 | 行宽 | 这以像素为单位用作线条描边宽度 |
| 3 | 线阿尔法 | 介于 0(透明)和 1(不透明)之间,充当浮点 |
| 4 | 行连接 | 如何将路径段连接在一起。定义值有:'miter' (miter_join)、'round' (round_join)、'bevel' (bevel_join) |
| 5 | 线帽 | 如何终止路径段。定义值有:'butt' (butt_cap)、'round' (round_cap)、'square' (square_cap) |
| 6 | 虚线 | B这用于线条样式。定义值为:'solid'、'dashed'、'dotted'、'dotdash'、'dashdot' |
| 7 | 虚线偏移量 | 到 line_dash 的距离(以像素为单位),图案应从该距离开始 |
填充属性
下面列出了各种填充属性 -
| 1 | 填色 | 这用于填充路径 |
| 2 | 填充阿尔法 | 介于 0(透明)和 1(不透明)之间,充当浮点 |
文本属性
有许多与文本相关的属性,如下表所示 -
| 1 | 文本字体 | 字体名称,例如“times”、“helvetica” |
| 2 | 文本字体大小 | 字体大小,以 px、em 或 pt 为单位,例如“12pt”、“1.5em” |
| 3 | 文本字体样式 | 使用的字体样式 '正常' '斜体' '粗体' |
| 4 | 文字颜色 | 这用于渲染文本 |
| 5 | 文本阿尔法 | 介于 0(透明)和 1(不透明)之间,这是一个浮点数 |
| 6 | 文本对齐 | 文本的水平锚点 - '左'、'右'、'中心' |
| 7 | 文本基线 | 文本“顶部”、“中间”、“底部”、“字母”、“悬挂”的垂直锚点 |
Bokeh - 自定义图例
图中的各种字形可以通过图例属性来识别,默认情况下作为标签出现在绘图区域的右上角位置。该图例可以通过以下属性自定义 -
| 1 | legend.label_text_font | 将默认标签字体更改为指定字体名称 | |
| 2 | legend.label_text_font_size | 字体大小(以磅为单位) | |
| 3 | 图例.位置 | 将标签设置在指定位置。 | |
| 4 | 图例.标题 | 设置图例标签的标题 | |
| 5 | 图例.方向 | 设置为水平(默认)或垂直 | |
| 6 | legend.clicking_policy | 指定单击图例时应发生的情况隐藏:隐藏与图例对应的字形静音:静音与图例对应的字形td> |
例子
图例定制的示例代码如下 -
from bokeh.plotting import figure, output_file, show
import math
x2 = list(range(1,11))
y4 = [math.pow(i,2) for i in x2]
y2 = [math.log10(pow(10,i)) for i in x2]
fig = figure(y_axis_type = 'log')
fig.circle(x2, y2,size = 5, color = 'blue', legend = 'blue circle')
fig.line(x2,y4, line_width = 2, line_color = 'red', legend = 'red line')
fig.legend.location = 'top_left'
fig.legend.title = 'Legend Title'
fig.legend.title_text_font = 'Arial'
fig.legend.title_text_font_size = '20pt'
show(fig)
输出

Bokeh - 添加小部件
bokeh.models.widgets 模块包含类似于 HTML 表单元素的 GUI 对象的定义,例如按钮、滑块、复选框、单选按钮等。这些控件为绘图提供交互界面。修改绘图数据、更改绘图参数等调用处理可以通过在相应事件上执行的自定义 JavaScript 函数来执行。
Bokeh 允许使用两种方法定义回调功能 -
使用CustomJS 回调,以便在独立的 HTML 文档中进行交互。
使用Bokeh 服务器并设置事件处理程序。
在本节中,我们将了解如何添加 Bokeh 小部件并分配 JavaScript 回调。
按钮
该小部件是一个可单击的按钮,通常用于调用用户定义的回调处理程序。构造函数采用以下参数 -
Button(label, icon, callback)
label 参数是用作按钮标题的字符串,callback 是单击时要调用的自定义 JavaScript 函数。
在以下示例中,绘图和按钮小部件显示在列布局中。该图本身呈现 x 和 y 数据系列之间的线字形。
已使用CutomJS() 函数定义了名为“callback”的自定义 JavaScript 函数。它接收对表单变量 cb_obj 中触发回调的对象(在本例中为按钮)的引用。
此函数更改源 ColumnDataSource 数据,并最终在源数据中发出此更新。
from bokeh.layouts import column
from bokeh.models import CustomJS, ColumnDataSource
from bokeh.plotting import Figure, output_file, show
from bokeh.models.widgets import Button

x = [x*0.05 for x in range(0, 200)]
y = x

source = ColumnDataSource(data=dict(x=x, y=y))
plot = Figure(plot_width=400, plot_height=400)
plot.line('x', 'y', source=source, line_width=3, line_alpha=0.6)

callback = CustomJS(args=dict(source=source), code="""
   var data = source.data;
   x = data['x']
   y = data['y']
   for (i = 0; i < x.length; i++) {
      y[i] = Math.pow(x[i], 4)
   }
   source.change.emit();
""")

btn = Button(label="click here", callback=callback, name="1")

layout = column(btn , plot)
show(layout)
输出(初始)

单击绘图顶部的按钮,查看更新后的绘图,如下所示 -
输出(点击后)

滑块
借助滑块控件,可以在分配给它的开始和结束属性之间选择一个数字。
Slider(start, end, step, value)
在下面的示例中,我们在滑块的 on_change 事件上注册一个回调函数。滑块的瞬时数值以 cb_obj.value 的形式提供给处理程序,用于修改 ColumnDatasource 数据。当您滑动位置时,绘图会不断更新。
from bokeh.layouts import column
from bokeh.models import CustomJS, ColumnDataSource
from bokeh.plotting import Figure, output_file, show
from bokeh.models.widgets import Slider

x = [x*0.05 for x in range(0, 200)]
y = x

source = ColumnDataSource(data=dict(x=x, y=y))
plot = Figure(plot_width=400, plot_height=400)
plot.line('x', 'y', source=source, line_width=3, line_alpha=0.6)

handler = CustomJS(args=dict(source=source), code="""
   var data = source.data;
   var f = cb_obj.value
   var x = data['x']
   var y = data['y']
   for (var i = 0; i < x.length; i++) {
      y[i] = Math.pow(x[i], f)
   }
   source.change.emit();
""")

slider = Slider(start=0.0, end=5, value=1, step=.25, title="Slider Value")

slider.js_on_change('value', handler)
layout = column(slider, plot)
show(layout)
输出

无线电集团
该小部件呈现了一组互斥的切换按钮,在标题左侧显示圆形按钮。
RadioGroup(labels, active)
其中,labels 是标题列表,active 是所选选项的索引。
选择
该小部件是一个简单的字符串项目下拉列表,可以选择其中之一。选定的字符串出现在顶部窗口,它是值参数。
Select(options, value)
下拉列表中的字符串元素列表以选项列表对象的形式给出。
以下是单选按钮和选择小部件的组合示例,两者都提供 x 和 y 数据系列之间的三种不同关系。RadioGroup和Select 小部件通过 on_change() 方法注册到各自的处理程序。
from bokeh.layouts import column
from bokeh.models import CustomJS, ColumnDataSource
from bokeh.plotting import Figure, output_file, show
from bokeh.models.widgets import RadioGroup, Select

x = [x*0.05 for x in range(0, 200)]
y = x

source = ColumnDataSource(data=dict(x=x, y=y))

plot = Figure(plot_width=400, plot_height=400)
plot.line('x', 'y', source=source, line_width=3, line_alpha=0.6)

radiohandler = CustomJS(args=dict(source=source), code="""
   var data = source.data;
   console.log('Tap event occurred at x-position: ' + cb_obj.active);
   //plot.title.text=cb_obj.value;
   x = data['x']
   y = data['y']
   if (cb_obj.active==0){
      for (i = 0; i < x.length; i++) {
         y[i] = x[i];
      }
   }
   if (cb_obj.active==1){
      for (i = 0; i < x.length; i++) {
         y[i] = Math.pow(x[i], 2)
      }
   }
   if (cb_obj.active==2){
      for (i = 0; i < x.length; i++) {
         y[i] = Math.pow(x[i], 4)
      }
   }
   source.change.emit();
""")

selecthandler = CustomJS(args=dict(source=source), code="""
   var data = source.data;
   console.log('Tap event occurred at x-position: ' + cb_obj.value);
   //plot.title.text=cb_obj.value;
   x = data['x']
   y = data['y']
   if (cb_obj.value=="line"){
      for (i = 0; i < x.length; i++) {
         y[i] = x[i];
      }
   }
   if (cb_obj.value=="SquareCurve"){
      for (i = 0; i < x.length; i++) {
         y[i] = Math.pow(x[i], 2)
      }
   }
   if (cb_obj.value=="CubeCurve"){
      for (i = 0; i < x.length; i++) {
         y[i] = Math.pow(x[i], 4)
      }
   }
   source.change.emit();
""")

radio = RadioGroup(
   labels=["line", "SqureCurve", "CubeCurve"], active=0)
radio.js_on_change('active', radiohandler)
select = Select(title="Select:", value='line', options=["line", "SquareCurve", "CubeCurve"])
select.js_on_change('value', selecthandler)

layout = column(radio, select, plot)
show(layout)
输出


选项卡小部件
就像在浏览器中一样,每个选项卡可以显示不同的网页,选项卡小部件是 Bokeh 模型,为每个图形提供不同的视图。在以下示例中,正弦和余弦曲线的两个绘图图形在两个不同的选项卡中呈现 -
from bokeh.plotting import figure, output_file, show
from bokeh.models import Panel, Tabs
import numpy as np
import math
x=np.arange(0, math.pi*2, 0.05)
fig1=figure(plot_width=300, plot_height=300)

fig1.line(x, np.sin(x),line_width=2, line_color='navy')

tab1 = Panel(child=fig1, title="sine")
fig2=figure(plot_width=300, plot_height=300)
fig2.line(x,np.cos(x), line_width=2, line_color='orange')
tab2 = Panel(child=fig2, title="cos")

tabs = Tabs(tabs=[ tab1, tab2 ])

show(tabs)
输出

Bokeh - 服务器
Bokeh 架构采用解耦设计,其中绘图和字形等对象是使用 Python 创建的,并转换为 JSON 以便由BokehJS 客户端库使用。
然而,在Bokeh Server的帮助下,可以使 python 和浏览器中的对象保持彼此同步。它能够利用 Python 的全部功能响应浏览器中生成的用户界面 (UI) 事件。它还有助于自动将服务器端更新推送到浏览器中的小部件或绘图。
Bokeh 服务器使用用 Python 编写的应用程序代码来创建 Bokeh 文档。来自客户端浏览器的每个新连接都会导致 Bokeh 服务器仅为该会话创建一个新文档。

首先,我们必须开发一个提供给客户端浏览器的应用程序代码。以下代码呈现正弦波线字形。除了绘图之外,还呈现滑块控件来控制正弦波的频率。回调函数update_data()以滑块的瞬时值作为当前频率来更新ColumnDataSource数据。
import numpy as np
from bokeh.io import curdoc
from bokeh.layouts import row, column
from bokeh.models import ColumnDataSource
from bokeh.models.widgets import Slider, TextInput
from bokeh.plotting import figure
N = 200
x = np.linspace(0, 4*np.pi, N)
y = np.sin(x)
source = ColumnDataSource(data = dict(x = x, y = y))
plot = figure(plot_height = 400, plot_width = 400, title = "sine wave")
plot.line('x', 'y', source = source, line_width = 3, line_alpha = 0.6)
freq = Slider(title = "frequency", value = 1.0, start = 0.1, end = 5.1, step = 0.1)
def update_data(attrname, old, new):
   a = 1
   b = 0
   w = 0
   k = freq.value
   x = np.linspace(0, 4*np.pi, N)
   y = a*np.sin(k*x + w) + b
   source.data = dict(x = x, y = y)
freq.on_change('value', update_data)
curdoc().add_root(row(freq, plot, width = 500))
curdoc().title = "Sliders"
接下来,通过以下命令行启动 Bokeh 服务器 -
Bokeh serve –show sliders.py
Bokeh 服务器开始运行并为 a