- GWT Google 图表教程
- GWT Google 图表 - 主页
- GWT Google 图表 - 概述
- 环境设置
- 配置语法
- GWT Google Charts - 面积图
- GWT Google Charts - 条形图
- GWT Google Charts - 气泡图
- GWT Google 图表 - 烛台
- GWT Google Charts - 柱形图
- GWT Google 图表 - 组合
- GWT Google 图表 - 直方图
- GWT Google Charts - 折线图
- GWT Google 图表 - 地图
- GWT Google 图表 - 组织
- GWT Google Charts - 饼图
- GWT Google 图表 - 桑基图表
- GWT Google 图表 - 散点图
- GWT Google 图表 - 阶梯区域
- GWT Google Charts - 表格图表
- GWT Google 图表 - 树形图图表
- GWT Google 图表资源
- GWT Google 图表 - 快速指南
- GWT Google 图表 - 资源
- GWT Google 图表 - 讨论
GWT Google Charts - 组织结构图
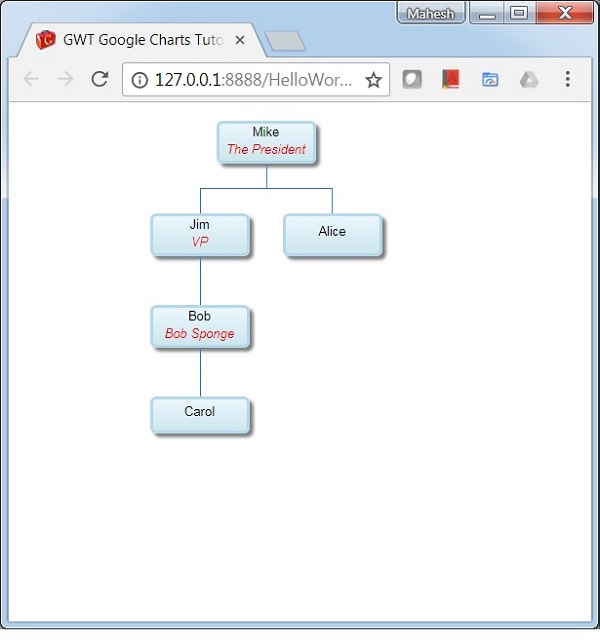
以下是组织结构图的示例。
组织结构图有助于呈现节点的层次结构,用于描绘组织中的上级/下级关系。例如,家谱是一种组织结构图。我们已经在Google Charts 配置语法章节中看到了用于绘制图表的配置。现在,让我们看一个组织结构图的示例。
配置
我们使用OrgChart类来显示组织结构图。
// Organization chart
OrgChart chart = new OrgChart();
例子
HelloWorld.java
package com.tutorialspoint.client;

import com.google.gwt.core.client.EntryPoint;
import com.google.gwt.user.client.ui.RootPanel;

import com.googlecode.gwt.charts.client.ChartLoader;
import com.googlecode.gwt.charts.client.ChartPackage;
import com.googlecode.gwt.charts.client.ColumnType;
import com.googlecode.gwt.charts.client.DataTable;
import com.googlecode.gwt.charts.client.format.PatternFormat;
import com.googlecode.gwt.charts.client.orgchart.OrgChart;
import com.googlecode.gwt.charts.client.orgchart.OrgChartOptions;

public class HelloWorld implements EntryPoint {
   private OrgChart chart;

   private void initialize() {
      ChartLoader chartLoader = new ChartLoader(ChartPackage.ORGCHART);
      chartLoader.loadApi(new Runnable() {
         public void run() {
            // Create and attach the chart
            chart = new OrgChart();
            RootPanel.get().add(chart);
            draw();
         }
      });
   }
   private void draw() {
      // Prepare the data
      DataTable dataTable = DataTable.create();
      dataTable.addColumn(ColumnType.STRING, "Name");
      dataTable.addColumn(ColumnType.STRING, "Manager");
      dataTable.addColumn(ColumnType.STRING, "ToolTip");
      dataTable.addRows(5);

      dataTable.setValue(0, 0, "Mike");
      dataTable.setValue(0, 1, "");
      dataTable.setValue(0, 2, "The President");
      dataTable.setValue(1, 0, "Jim");
      dataTable.setValue(1, 1, "Mike");
      dataTable.setValue(1, 2, "VP");
      dataTable.setValue(2, 0, "Alice");
      dataTable.setValue(2, 1, "Mike");
      dataTable.setValue(2, 2, "");
      dataTable.setValue(3, 0, "Bob");
      dataTable.setValue(3, 1, "Jim");
      dataTable.setValue(3, 2, "Bob Sponge");
      dataTable.setValue(4, 0, "Carol");
      dataTable.setValue(4, 1, "Bob");
      dataTable.setValue(4, 2, "");

      PatternFormat format = PatternFormat.create("{0} {1}");
      format.format(dataTable, 0, 2);

      // Set options
      OrgChartOptions options = OrgChartOptions.create();
      options.setAllowHtml(true);

      // Draw the chart
      chart.draw(dataTable, options);
      chart.setWidth("400px");
      chart.setHeight("400px");
   }
   public void onModuleLoad() {
      initialize();
   }
}
结果
验证结果。