- Excel Power View 教程
- Excel Power View - 主页
- 概述
- 创建
- 床单
- 可视化
- 表格可视化
- 矩阵可视化
- 卡片可视化
- 图表可视化
- 折线图可视化
- 条形图可视化
- 柱形图可视化
- 散点图和气泡图可视化
- 饼图可视化
- 地图可视化
- 多重可视化
- 平铺可视化
- 高级功能
- Excel Power View 和数据模型
- 层次结构
- 关键绩效指标
- 格式化报告
- 分享
- Excel Power View 有用资源
- Excel Power View - 快速指南
- Excel Power View - 有用的资源
- Excel Power View - 讨论
Excel Power View - 创建
Power View 就像一块画布,您可以根据数据模型在上面进行任意数量的可视化。您需要从创建 Power View 工作表开始,然后将数据表中的字段添加到 Power View 中以可视化和探索数据。
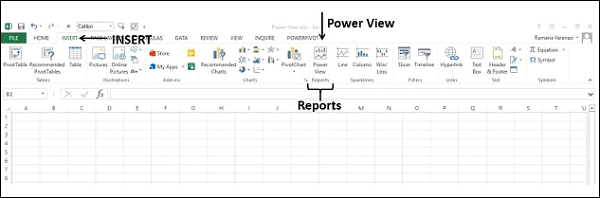
在开始使用 Power View 进行数据探索之前,请确保 Power View 加载项已启用并且在功能区上可用。
单击功能区上的插入选项卡。Power View 应在功能区的“报告”组中可见。
启用 Power View 插件
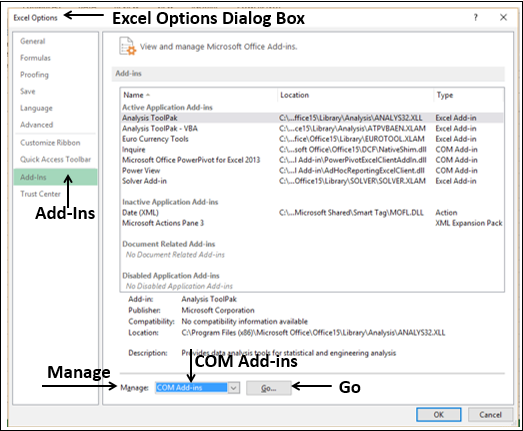
如果在功能区上没有找到 Power View,则需要启用 Power View 加载项。
单击功能区上的“文件”选项卡。
单击选项。
单击“Excel 选项”对话框中的“加载项”。
单击“管理”框中的下拉箭头。
从下拉列表中选择COM 加载项,然后单击转到。
将出现 COM 加载项对话框。选中“Power View”框并单击“确定”。
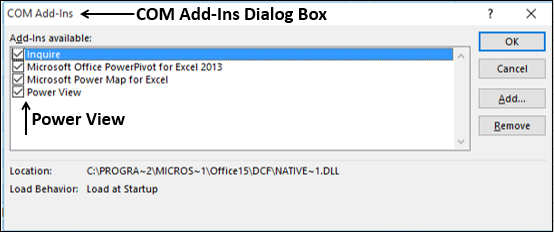
Power View 将在功能区上可见。
创建电源视图表
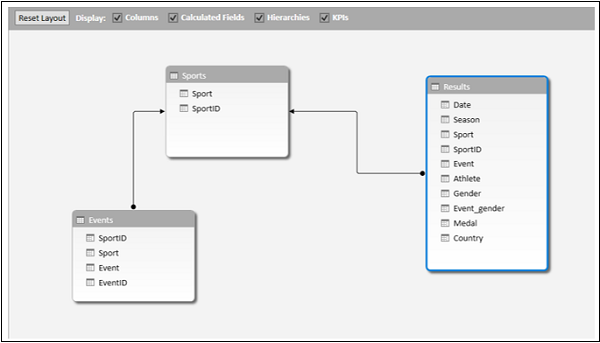
您可以从数据模型中的数据表创建 Power View。
假设您的工作簿中有以下数据模型。
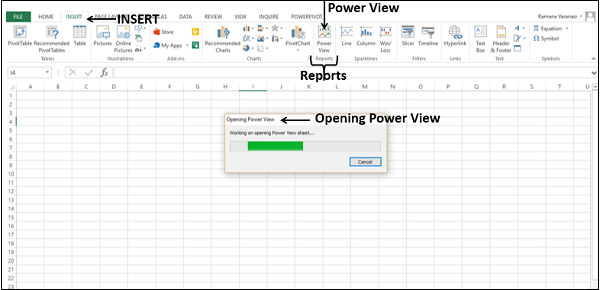
要创建 Power View 工作表,请执行以下操作 -
- 单击 Excel 窗口功能区上的插入选项卡。
- 单击“报告”组中的“Power View”。
将出现“正在打开 Power View”消息框,并带有水平滚动的绿色状态栏。这可能需要一些时间。
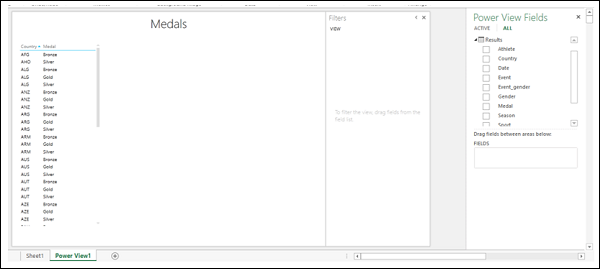
Power View工作表将作为 Excel 工作簿中的工作表创建。它包含一个空的 Power View 区域、筛选器区域和显示数据模型中的表的 Power View 字段列表。Power View 在 Power View 工作表的功能区上显示为选项卡。
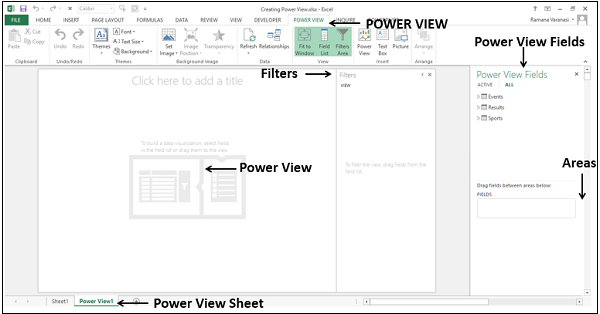
您将在下一章中了解 Power View 表的这些不同部分。
创建电源视图
在本节中,您将了解如何在 Power View 工作表中创建 Power View。
假设您要显示每个国家赢得的奖牌。
从“结果”表中选择“国家/地区”和“奖牌”字段。这两个字段出现在“区域”中的“字段”下。Power View 将显示为表格,其中两个选定字段作为列。
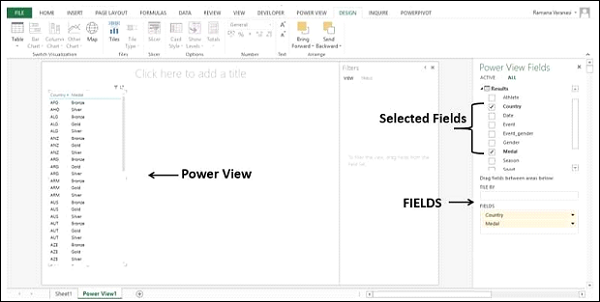
正如您所看到的,Power View 正在显示每个国家获得的奖牌。
- 单击 Power View 工作表的标题。
- 类型奖牌。