- Matplotlib 教程
- Matplotlib - 主页
- Matplotlib - 简介
- Matplotlib - 环境设置
- Matplotlib - Anaconda 分布
- Matplotlib - Jupyter 笔记本
- Matplotlib - Pyplot API
- Matplotlib - 简单绘图
- Matplotlib - PyLab 模块
- 面向对象的接口
- Matplotlib - 图形类
- Matplotlib - 轴类
- Matplotlib - 多图
- Matplotlib - Subplots() 函数
- Matplotlib - Subplot2grid() 函数
- Matplotlib - 网格
- Matplotlib - 格式化轴
- Matplotlib - 设置限制
- 设置刻度和刻度标签
- Matplotlib - 双轴
- Matplotlib - 条形图
- Matplotlib - 直方图
- Matplotlib - 饼图
- Matplotlib - 散点图
- Matplotlib - 等值线图
- Matplotlib - 箭袋图
- Matplotlib - 箱线图
- Matplotlib - 小提琴图
- 三维绘图
- Matplotlib - 3D 等高线图
- Matplotlib - 3D 线框图
- Matplotlib - 3D 曲面图
- Matplotlib - 处理文本
- 数学表达式
- Matplotlib - 处理图像
- Matplotlib - 变换
- Matplotlib 有用资源
- Matplotlib - 快速指南
- Matplotlib - 有用的资源
- Matplotlib - 讨论
Matplotlib - 3D 等高线图
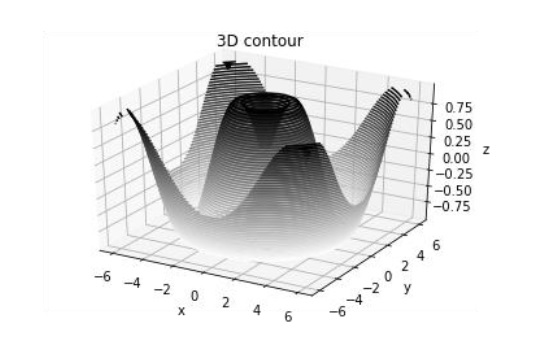
ax.contour3D ()函数创建三维等高线图。它要求所有输入数据均采用二维规则网格的形式,并在每个点评估 Z 数据。在这里,我们将展示三维正弦函数的三维等值线图。
from mpl_toolkits import mplot3d
import numpy as np
import matplotlib.pyplot as plt
def f(x, y):
   return np.sin(np.sqrt(x ** 2 + y ** 2))

x = np.linspace(-6, 6, 30)
y = np.linspace(-6, 6, 30)

X, Y = np.meshgrid(x, y)
Z = f(X, Y)

fig = plt.figure()
ax = plt.axes(projection='3d')
ax.contour3D(X, Y, Z, 50, cmap='binary')
ax.set_xlabel('x')
ax.set_ylabel('y')
ax.set_zlabel('z')
ax.set_title('3D contour')
plt.show()
