- Matplotlib 教程
- Matplotlib - 主页
- Matplotlib - 简介
- Matplotlib - 环境设置
- Matplotlib - Anaconda 分布
- Matplotlib - Jupyter 笔记本
- Matplotlib - Pyplot API
- Matplotlib - 简单绘图
- Matplotlib - PyLab 模块
- 面向对象的接口
- Matplotlib - 图形类
- Matplotlib - 轴类
- Matplotlib - 多图
- Matplotlib - Subplots() 函数
- Matplotlib - Subplot2grid() 函数
- Matplotlib - 网格
- Matplotlib - 格式化轴
- Matplotlib - 设置限制
- 设置刻度和刻度标签
- Matplotlib - 双轴
- Matplotlib - 条形图
- Matplotlib - 直方图
- Matplotlib - 饼图
- Matplotlib - 散点图
- Matplotlib - 等值线图
- Matplotlib - 箭袋图
- Matplotlib - 箱线图
- Matplotlib - 小提琴图
- 三维绘图
- Matplotlib - 3D 等高线图
- Matplotlib - 3D 线框图
- Matplotlib - 3D 曲面图
- Matplotlib - 处理文本
- 数学表达式
- Matplotlib - 处理图像
- Matplotlib - 变换
- Matplotlib 有用资源
- Matplotlib - 快速指南
- Matplotlib - 有用的资源
- Matplotlib - 讨论
Matplotlib - 数学表达式
您可以在任何 Matplotlib 文本字符串中使用 TeXmarkup 子集,方法是将其放置在一对美元符号 ($) 内。
# math text
plt.title(r'$\alpha > \beta$')
要制作下标和上标,请使用“_”和“^”符号 -
r'$\alpha_i> \beta_i$'

import numpy as np
import matplotlib.pyplot as plt
t = np.arange(0.0, 2.0, 0.01)
s = np.sin(2*np.pi*t)

plt.plot(t,s)
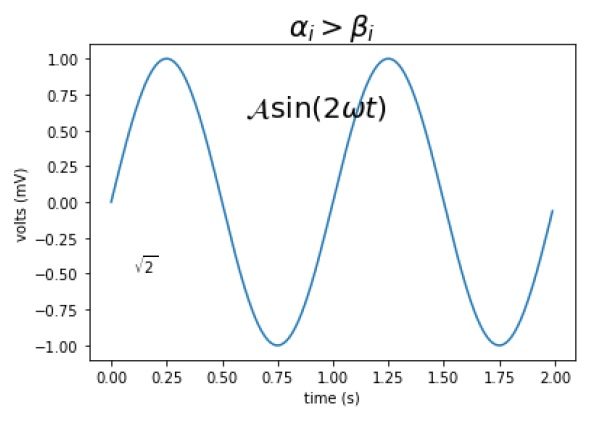
plt.title(r'$\alpha_i> \beta_i$', fontsize=20)

plt.text(0.6, 0.6, r'$\mathcal{A}\mathrm{sin}(2 \omega t)$', fontsize = 20)
plt.text(0.1, -0.5, r'$\sqrt{2}$', fontsize=10)
plt.xlabel('time (s)')
plt.ylabel('volts (mV)')
plt.show()
上面的代码行将生成以下输出 -
