- Matplotlib 教程
- Matplotlib - 主页
- Matplotlib - 简介
- Matplotlib - 环境设置
- Matplotlib - Anaconda 分布
- Matplotlib - Jupyter 笔记本
- Matplotlib - Pyplot API
- Matplotlib - 简单绘图
- Matplotlib - PyLab 模块
- 面向对象的接口
- Matplotlib - 图形类
- Matplotlib - 轴类
- Matplotlib - 多图
- Matplotlib - Subplots() 函数
- Matplotlib - Subplot2grid() 函数
- Matplotlib - 网格
- Matplotlib - 格式化轴
- Matplotlib - 设置限制
- 设置刻度和刻度标签
- Matplotlib - 双轴
- Matplotlib - 条形图
- Matplotlib - 直方图
- Matplotlib - 饼图
- Matplotlib - 散点图
- Matplotlib - 等值线图
- Matplotlib - 箭袋图
- Matplotlib - 箱线图
- Matplotlib - 小提琴图
- 三维绘图
- Matplotlib - 3D 等高线图
- Matplotlib - 3D 线框图
- Matplotlib - 3D 曲面图
- Matplotlib - 处理文本
- 数学表达式
- Matplotlib - 处理图像
- Matplotlib - 变换
- Matplotlib 有用资源
- Matplotlib - 快速指南
- Matplotlib - 有用的资源
- Matplotlib - 讨论
Matplotlib - PyLab 模块
PyLab 是 Matplotlib 面向对象绘图库的程序接口。Matplotlib 是整个包;matplotlib.pyplot 是 Matplotlib 中的一个模块;PyLab 是与 Matplotlib 一起安装的模块。
PyLab 是一个便捷模块,可在单个名称空间中批量导入 matplotlib.pyplot(用于绘图)和 NumPy(用于数学和处理数组)。尽管许多示例使用 PyLab,但不再推荐。
基本绘图
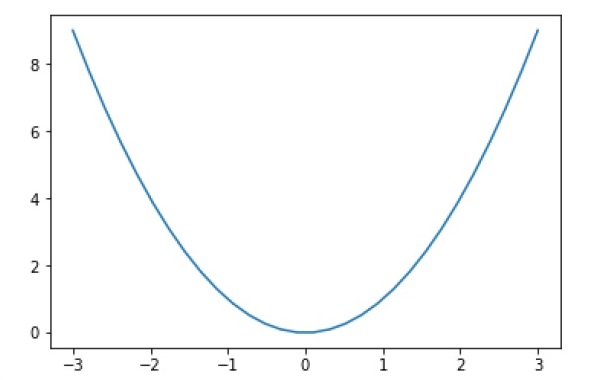
绘制曲线是使用plot 命令完成的。它需要一对相同长度的数组(或序列) -
from numpy import *
from pylab import *
x = linspace(-3, 3, 30)
y = x**2
plot(x, y)
show()
上面的代码行生成以下输出 -
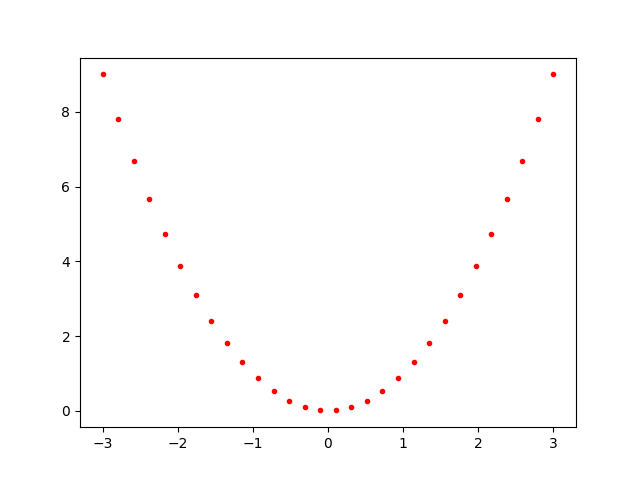
要绘制符号而不是线条,请提供额外的字符串参数。
| 符号 | - , –, -., , . , , , o , ^ , v , < , > , s , + , x , D , d , 1 , 2 , 3 , 4 , h , H , p , | , _ |
| 颜色 | b、g、r、c、m、y、k、w |
现在,考虑执行以下代码 -
from pylab import *
x = linspace(-3, 3, 30)
y = x**2
plot(x, y, 'r.')
show()
它绘制红点,如下所示 -
绘图可以重叠。只需使用多个绘图命令即可。使用 clf() 清除绘图。
from pylab import *
plot(x, sin(x))
plot(x, cos(x), 'r-')
plot(x, -sin(x), 'g--')
show()
上面的代码行生成以下输出 -
